

Truck profitability analysis is the process of calculating and comparing your cost per mile (CPM), revenue per mile (RPM), and profit per mile (PPM) to measure your trucking operation’s true financial health. These three metrics, known collectively as the per-mile framework, are the industry standard for understanding how truck profitability analysis works at both the fleet and individual load level. Most trucking owners track revenue but skip the full cost picture. That gap is exactly where profit disappears. This guide breaks down each metric, shows you how to calculate them accurately, and explains how to use them to make smarter decisions every day.
How truck profitability analysis works: the core metrics
Truck profitability analysis starts with three numbers: CPM, RPM, and PPM. Each one tells you something different, and you need all three to get a complete picture of your financial performance.
Cost Per Mile (CPM) is your total operating expenses divided by total miles driven, including deadhead. It tells you what it costs to move your truck one mile. Revenue Per Mile (RPM) is your total revenue divided by total miles. Profit Per Mile (PPM) is the difference: RPM minus CPM. That gap is your take-home margin before taxes.

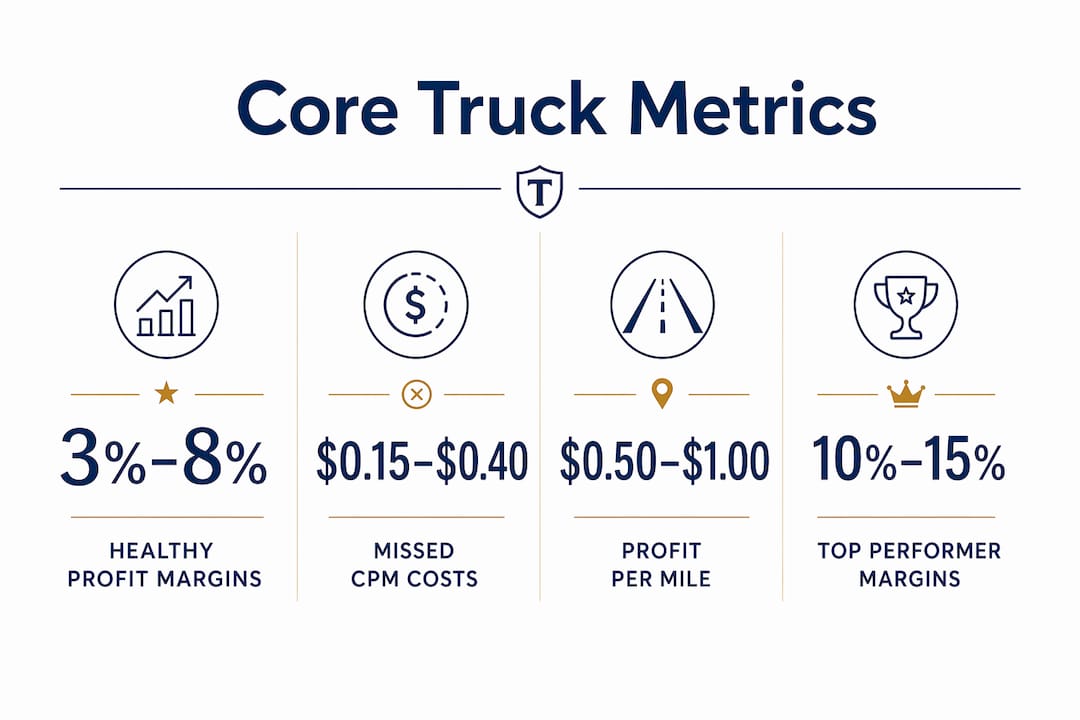
Industry benchmarks put healthy profit margins at 3%–8% for most fleets, with top performers reaching 10%–15%. A strong PPM for owner-operators falls between $0.50 and $1.00 post-expenses, with top performers hitting $1.00–$1.50. Those numbers give you a target to measure yourself against.
The per-mile framework works because it normalizes everything to a single unit. A load paying $2,000 sounds good. But if it covers 1,200 miles and your CPM is $1.80, your PPM is only $0.87. That context is what separates informed decisions from guesswork.
What costs go into a truck profitability analysis?
Accurate cost tracking is the foundation of any reliable profitability analysis. Trucking costs fall into two categories: fixed and variable.
Fixed costs stay the same regardless of miles driven. They include:
- Truck and trailer payments
- Insurance premiums
- Permits and licenses
- Registration fees
- Depreciation
Variable costs change with miles and activity. They include:
- Fuel
- Driver pay and benefits
- Maintenance and repairs
- Tires
- Tolls and scale tickets
- Factoring fees (typically 1.5%–4% of revenue)
The most dangerous costs are the ones owners forget entirely. Most owners underestimate CPM by $0.15–$0.40 per mile because they leave out items like DEF fluid, parking fees, owner’s own labor, and depreciation. That underestimation means you think you are profitable when you are actually breaking even or losing money.
To calculate CPM, add up every fixed and variable expense for a given period, then divide by total miles driven, including deadhead. Do not use only loaded miles. Deadhead miles still cost you fuel, time, and wear. Omitting small expenses causes a $0.15–$0.25 underestimation on its own. Every line item matters.
Pro Tip: Build a simple monthly expense spreadsheet that captures every cost category, including owner salary and a depreciation line for your equipment. Review it against your bank and fuel card statements before closing each month. Missing even two or three small categories will skew every profitability decision you make.
You can also reference the full list of trucking expenses to make sure nothing falls through the cracks. Recalculate your CPM at least quarterly. Diesel prices, insurance renewals, and seasonal idling all shift your cost structure in ways that a once-a-year calculation will not catch.
How does revenue per mile affect your profit picture?
Revenue per mile sounds simple, but most operators calculate it wrong. The most common mistake is dividing total revenue by loaded miles only. That overstates your RPM and hides the real cost of running empty.
True RPM uses total miles, both loaded and deadhead. Deadhead rates vary from 8%–25% of total miles for most operators. At 20% deadhead, a route that looks like it pays $2.50 per loaded mile actually pays $2.00 per total mile. That $0.50 difference can flip a profitable lane into a marginal one.
Your total revenue calculation should include all sources:
- Line haul rate
- Fuel surcharges
- Detention pay
- Accessorial charges (lumper reimbursements, layover pay, stop-off fees)
Many operators leave accessorials off their revenue tracking entirely. That is money you earned and paid taxes on, but never counted in your margin analysis. Using total-mile RPM instead of loaded-mile RPM reveals the true revenue effect of deadhead and improves load acceptance decisions.
Contractual terms also affect your effective RPM. Rate agreements that cap fuel surcharges or exclude detention pay reduce your actual revenue below what the rate confirmation shows. Read every contract with your CPM in mind, not just the headline rate.
Pro Tip: Track your deadhead miles separately in your dispatch records every week. Calculate your deadhead percentage monthly. If it climbs above 15%, you have a lane selection or backhaul problem that is quietly eroding your margins.
What is profit per mile and how do you improve it?
Profit per mile is the single most critical metric for measuring your take-home earnings as an owner-operator. It is calculated as RPM minus CPM, and it tells you exactly how much you keep after expenses for every mile your truck moves.
A real-world example makes this concrete. At $2.32 RPM minus $1.45 CPM, your PPM is $0.87. At 8,000 miles per month, that equals $6,960 in monthly profit before taxes. Change the CPM to $1.65 and that same revenue drops your monthly profit to $5,360. A $0.20 shift in costs costs you over $19,000 per year.
The gap between RPM and CPM is your business. Every decision you make, from which loads you accept to how you maintain your equipment, either widens or narrows that gap. Operators who track PPM weekly make better load decisions, negotiate from a position of strength, and avoid the slow margin erosion that sinks otherwise busy trucking businesses.
Improving your PPM comes down to two levers: reduce CPM and increase RPM. Here are the most effective ways to move both:
- Negotiate better rates. Know your minimum acceptable RPM before every rate negotiation. Treat rate per mile and truck payment per mile as linked metrics. Never accept a load where the rate does not cover your CPM plus a target margin.
- Manage deadhead aggressively. Plan backhauls before you deliver. Use load boards to find return freight in the same region. Every empty mile you eliminate goes directly to PPM.
- Control fuel costs. Fuel is typically the largest variable cost. Use fuel card programs with network discounts, plan routes through cheaper fuel corridors, and monitor MPG by truck.
- Stay current on maintenance. Deferred maintenance raises repair costs and increases downtime. Both hurt PPM. A truck sitting in a shop earns zero revenue but still accrues fixed costs.
- Update your CPM quarterly. CPM fluctuates with diesel prices, insurance renewals, and seasonal idling. Winter CPM runs meaningfully higher than summer CPM for most operators. Using a stale CPM means you are pricing loads against a number that no longer reflects reality.
For a deeper look at how these metrics connect to your pricing decisions, the guide on trucking service pricing covers rate-setting from an operational perspective.
How does load-level profitability analysis improve decisions?
Fleet-level CPM and RPM averages are useful, but they hide the performance differences between individual loads, lanes, and customers. Load-level profitability analysis assigns both fixed and variable costs to each load so you can see exactly which freight makes money and which does not.
The method works like this. First, calculate your fixed cost per available mile by dividing annual fixed costs by total annual miles. Then assign variable costs, such as fuel, driver pay, and tolls, directly to each load based on actual figures. Add the deadhead miles associated with that load to the total mile count before calculating PPM for that specific movement.
Assigning fixed costs per available mile to individual loads creates a 10%–15% difference in margin assessment compared to using variable costs alone. That difference is large enough to change which lanes you prioritize and which customers you reprice.
| Load metric | What it measures | Why it matters |
|---|---|---|
| Load RPM (total miles) | Revenue per mile including deadhead | Shows true earning rate per movement |
| Load CPM (fixed + variable) | Full cost per mile for that load | Reveals actual margin, not just contribution |
| Load PPM | RPM minus CPM for that load | Identifies profitable vs. unprofitable freight |
| Deadhead % per load | Empty miles as a share of total miles | Quantifies the cost of poor backhaul planning |
Carriers that implement load profitability reviews reduce below-threshold freight and improve operating ratios over 12 months. The improvement comes from having data to act on, not from working harder.
Load-level data also changes how you handle customer relationships. If one shipper consistently generates loads with high deadhead and below-average rates, you can see that clearly in the numbers. You can reprice, renegotiate, or redirect capacity to better-performing freight. Without load-level visibility, you are managing by feel.
Pro Tip: Start with your five highest-volume lanes and run a full load-level analysis on each one. You will almost always find one lane that looks average at the fleet level but is actually your best performer, and one that looks fine but is quietly losing money once fixed costs are allocated.
For a structured approach to building this kind of reporting, the load profitability reporting guide from Truemeasureaccounting walks through the setup process in detail.
Key Takeaways
Truck profitability analysis works by calculating CPM, RPM, and PPM accurately, then applying those metrics at both the fleet and load level to drive smarter pricing, cost control, and capacity decisions.
| Point | Details |
|---|---|
| CPM accuracy is non-negotiable | Missing small expenses causes $0.15–$0.40 per-mile underestimation and distorts every profitability decision. |
| Use total-mile RPM, not loaded-mile RPM | Deadhead rates of 8%–25% make loaded-mile RPM a misleading number for real margin analysis. |
| PPM is your true performance metric | A $0.20 shift in CPM can cost over $19,000 per year at 8,000 monthly miles. |
| Recalculate CPM quarterly | Diesel prices, insurance renewals, and seasonal costs shift your cost structure throughout the year. |
| Load-level analysis changes decisions | Allocating fixed and variable costs to individual loads reveals a 10%–15% difference in margin assessment. |
What I have learned from watching trucking owners manage their numbers
The operators who build real wealth in trucking are not always the ones with the most trucks or the best rates. They are the ones who know their numbers cold. I have worked with trucking businesses across the Southeast, and the pattern is consistent: the owners who track CPM weekly make better decisions than the ones who check it once a year at tax time.
The most common mistake I see is treating revenue as profit. A busy truck is not the same as a profitable truck. I have sat with owner-operators running 10,000 miles a month who were genuinely surprised to learn they were earning less than $0.30 per mile after all costs were accounted for. The revenue looked great. The CPM was just never updated after fuel prices rose and insurance renewed at a higher rate.
The second mistake is ignoring owner’s labor. If you are driving the truck, your time has a cost. Leaving it out of CPM makes your operation look more profitable than it is. That false confidence leads to accepting loads at rates that do not actually sustain the business.
The fix is not complicated. Build a monthly cost tracking habit, recalculate CPM every quarter, and run load-level analysis on your top lanes at least twice a year. Connect those numbers to your load acceptance decisions and your rate negotiations. That is the difference between a trucking business that grows and one that stays busy but never gets ahead.
— Tony
Truemeasureaccounting helps trucking businesses see the full profit picture
Running a trucking business means managing fuel costs, driver pay, insurance, and equipment expenses all at once. Most owners do not have time to build the financial systems that make profitability analysis reliable. That is where Truemeasureaccounting comes in.
Truemeasureaccounting specializes in bookkeeping for trucking companies, with a focus on connecting your financial data to real operational decisions. From accurate CPM tracking to load-level profitability reporting, the team helps you see exactly where your margins stand and what to do about it. If your books are behind or your cost tracking is inconsistent, Truemeasureaccounting can get your financials organized and working for you. Explore the trucking accounting services to see how the firm supports owner-operators and small fleets nationwide.
FAQ
What is the difference between CPM and RPM in trucking?
CPM is your total cost divided by total miles driven. RPM is your total revenue divided by total miles. The gap between the two is your profit per mile.
How often should I recalculate my cost per mile?
Recalculate CPM at least quarterly. Diesel prices, insurance renewals, and seasonal operating costs shift your numbers enough that an annual calculation will lead you to accept loads at unprofitable rates.
Why does deadhead mileage matter in truck profit analysis?
Deadhead miles reduce your effective RPM because you are covering distance without earning revenue. Deadhead rates of 8%–25% are common, and failing to include them in your RPM calculation overstates your true earnings.
What is a healthy profit per mile for an owner-operator?
A healthy PPM falls between $0.50 and $1.00 post-expenses for most owner-operators. Top performers reach $1.00–$1.50 per mile. Industry operating margins typically run 3%–8%, with top fleets achieving 10%–15%.
What expenses do trucking owners most often miss in their cost calculations?
The most commonly missed expenses are owner’s labor, depreciation, DEF fluid, parking fees, and scale tickets. Ignoring depreciation and owner labor leads directly to underestimating real CPM and poor profitability assessment.
If your current reports do not connect financial activity to better operating decisions, schedule a conversation with TrueMeasure Accounting to identify the clearest next step.