

Load profitability reporting in trucking is the practice of measuring the true profit of each load by accounting for every related cost and revenue item to guide smarter operational and financial decisions. The role of load profitability reporting in trucking goes far beyond tracking revenue per mile. With industry-average total marginal costs running approximately $2.30 per mile and median net profit margins for general freight trucking near 4.2%, the gap between a profitable carrier and a struggling one often comes down to load-level financial clarity. Trucking company owners and logistics managers who treat every load as its own profit center gain a decisive edge over those who manage by revenue alone. This guide covers the key metrics, common pitfalls, and practical workflows that make load-level profitability analysis work in the real world.
What are the key metrics and formulas in load profitability reporting?
The foundation of any trucking profitability analysis is the Effective Rate Per Mile formula: Gross Revenue divided by the sum of loaded miles plus deadhead miles. This calculation forces you to account for the empty miles that eat into your margin on every run. Most carriers who skip deadhead in their math are systematically overestimating how profitable their freight actually is.
Here are the core profitability metrics every trucking owner and logistics manager needs to track:
- Effective Rate Per Mile: Gross Revenue ÷ (Loaded Miles + Deadhead Miles). This is your true revenue rate, not the inflated loaded-miles-only figure.
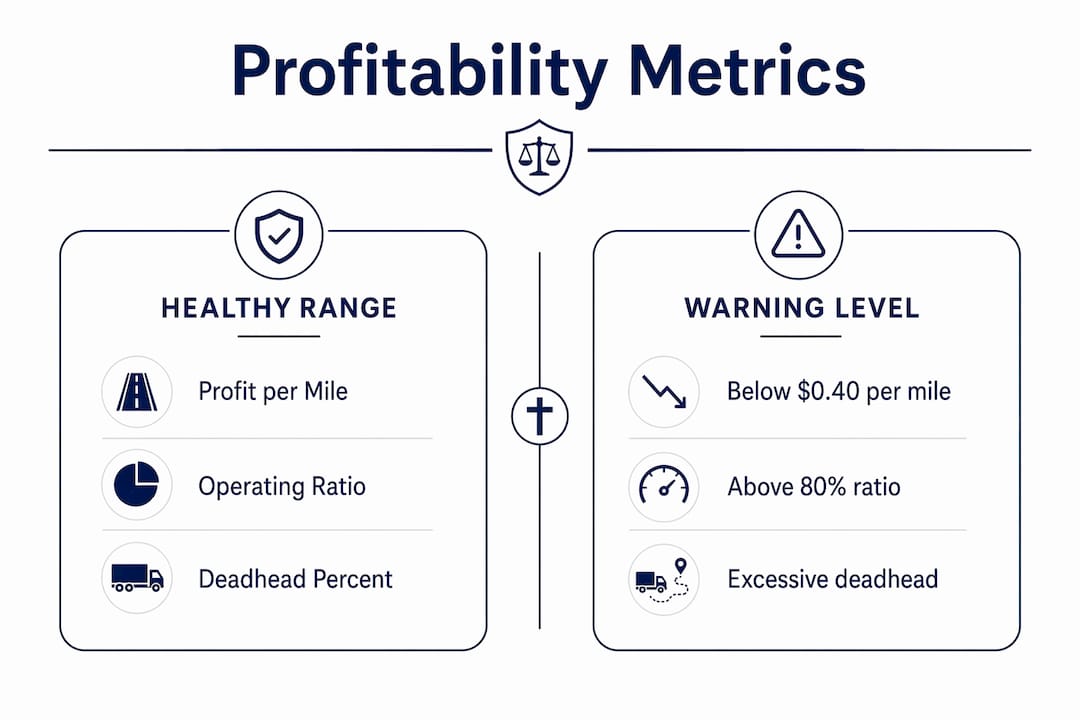
- Profit Per Mile: Revenue minus all direct costs, divided by total miles. A healthy profit per mile falls in the $0.50–$1.00 range. Values below $0.40 signal urgent repricing.
- Operating Ratio (OR): Total operating expenses divided by gross revenue, expressed as a percentage. Lower is better. Top LTL carriers maintain operating ratios between 76% and 92%. Struggling truckload carriers often sit near or above 97%.
- Cost Per Mile: All fixed and variable costs divided by total miles driven. This is the denominator that makes every other metric meaningful.
- Net Profit Per Load: The dollar amount left after all costs are subtracted from gross load revenue. This is the number that actually tells you whether a load was worth running.
A critical distinction separates normalized revenue from true profitability. Normalized rate per mile does not measure true profitability. Real profitability decisions anchor on the Operating Ratio, which reconciles with your general ledger and captures actual costs and time exposures at the load, lane, customer, and market level. That reconciliation step is what separates financial clarity from financial guesswork.
| Metric | Healthy Range | Warning Level |
|---|---|---|
| Profit per mile | $0.50–$1.00 | Below $0.40 |
| Operating ratio | 76%–92% | At or above 97% |
| Net margin (mid-size carriers) | 10%–14% EBITDA | Below 3%–7% |
| Effective rate per mile | Varies by lane | Below cost per mile |
Pro Tip: Track deadhead miles separately in your TMS or accounting system. Carriers who bundle deadhead into loaded-mile averages consistently underestimate their true cost per load.
Understanding these numbers at the load level, not just the monthly P&L level, is what separates carriers who grow profitably from those who grow themselves into a cash flow crisis.
How does load-level analysis improve operational efficiency?
Monthly load-level profitability reviews are the single most effective tool for improving your operating ratio. The process is straightforward: pull every load from the prior month, attach actual costs to each one, rank them by net profit, and identify the bottom performers. Those bottom performers either get repriced or replaced with better freight. Carriers who apply this discipline consistently improve their operating ratio by identifying and replacing unprofitable freight within 12 months.

The operational benefits extend well beyond the monthly review cycle. When you integrate cost data from fuel cards, driver settlements, and dispatch records into a single reporting view, your dispatchers stop making decisions based on broker-quoted rates alone. They start making decisions based on actual margin. That shift turns your dispatch team from a scheduling function into a profit-focused operation.
Here is a practical workflow for applying load-level analysis in daily operations:
- Pull load revenue from your TMS or settlement records for each completed load in the review period.
- Attach direct costs including fuel, driver pay, tolls, and any load-specific fees to each load record.
- Calculate effective rate per mile using total miles, not just loaded miles.
- Rank loads by profit per mile from highest to lowest.
- Flag any load below $0.40 per mile for immediate review. Determine whether the lane, customer, or rate is the root cause.
- Reprice or replace the bottom 20% of loads. Contact the broker or shipper with data to support a rate increase, or shift capacity to higher-margin freight.
One insight that surprises most trucking owners: more miles do not guarantee more profit. A properly costed short run can yield higher net profit than a long haul when you factor in dwell risk, cycle time, and network position. A 200-mile regional load that keeps a driver cycling twice per day can outperform a 1,000-mile run with a two-day layover. Load-level reporting makes that comparison visible.
Pro Tip: Build a simple load scoring sheet that ranks each load before acceptance, not after delivery. Score each load on rate per total mile, deadhead exposure, and destination quality. Loads that score below your cost threshold do not move.
What are common challenges in load profitability reporting?
The biggest obstacle to accurate load cost reporting in trucking is timing. Most carriers calculate profitability only after load completion. By then, the load has already moved and any losses are locked in. Pre-load profitability assessment, using effective rate per total mile before dispatch, is the only way to prevent unprofitable loads from moving in the first place.
Data fragmentation is the second major challenge. Fuel costs live in one system. Driver settlements live in another. Depreciation sits in your accounting software. Payroll is in a separate platform. Without aggregating these data sources, carriers rely on approximations instead of true profitability data. Those approximations consistently understate costs and overstate margins.
Here are the most common pitfalls and how to address each one:
- Relying on revenue per mile as a profitability proxy. Revenue per mile tells you nothing about costs. A load at $3.00 per loaded mile can still lose money if deadhead, fuel, and dwell push total costs above that figure.
- Ignoring deadhead in rate calculations. Every empty mile has a cost. Carriers who exclude deadhead from their effective rate calculations systematically accept freight that does not cover their true cost structure.
- Delayed cost entry. When fuel receipts, tolls, and driver settlements are entered days or weeks after a load closes, your profitability reports reflect history, not reality. Set a 48-hour cost entry standard for all load-related expenses.
- Allocating overhead costs inaccurately. Insurance, truck payments, and administrative costs must be spread across loads using a consistent method. Carriers who skip this step understate the true cost of every load they run.
- Accepting loads based on broker rates alone. Load scoring prevents this by ranking freight against your actual cost structure before acceptance. Broker-quoted rates are a starting point, not a profitability guarantee.
“The EBITDA margin gap between bottom and top-quartile operators is mostly structural. Improving load profitability requires disciplined load scoring and abandonment of broker-quoted rate acceptance as the primary decision filter.”
Fixing these challenges does not require a complete technology overhaul. It requires a clear process, consistent data entry, and a reporting routine that connects your operational data to your financial results.
How can trucking leaders implement load profitability workflows?
Building a load profitability reporting system starts with one decision: you will measure profit at the load level, not just the monthly P&L level. That commitment drives every system and process choice that follows.
Here is a practical implementation sequence for trucking owners and logistics managers:
- Establish your cost per mile baseline. Pull the last 90 days of operating expenses from your accounting records. Divide total costs by total miles. This number becomes your minimum acceptable rate threshold. You can find a detailed breakdown of which trucking expenses to track to build an accurate baseline.
- Set up load-level cost tracking in your TMS. Every load record should capture fuel cost, driver pay, tolls, broker fees, and any load-specific expenses at the time of settlement. If your current TMS does not support load-level cost entry, that is a system gap worth addressing.
- Integrate your TMS data with your accounting system. Automated solutions reduce manual error and delay, improving operational profit insight per load. The goal is a single reporting view that pulls from fuel cards, payroll, and dispatch records without manual re-entry.
- Build a pre-load scoring process. Before accepting any load, calculate the effective rate per total mile using the proposed rate and estimated deadhead. Compare that rate to your cost per mile threshold. Loads that do not clear the threshold require a rate negotiation or a pass.
- Run a monthly load profitability review. Rank every load from the prior month by net profit per mile. Review the bottom performers with your dispatch team. Identify whether the issue is the lane, the customer, the rate, or the deadhead exposure.
- Create a dashboard for real-time visibility. Dispatchers and managers need to see profitability data without waiting for month-end reports. A simple dashboard showing current-month profit per mile by driver, lane, and customer gives your team the information they need to make better decisions daily.
The comparison below shows how two approaches to load reporting differ in practice:
| Capability | Basic revenue tracking | Load-level profitability reporting |
|---|---|---|
| Cost visibility | Monthly totals only | Per-load cost allocation |
| Deadhead accounting | Often excluded | Included in effective rate |
| Decision timing | After load completion | Before load acceptance |
| Dispatcher role | Scheduling focused | Profit-margin focused |
| Repricing frequency | Quarterly or annual | Monthly or per-lane |
Trucking owners who want to connect their pricing strategy to actual load profitability data will find that the reporting system pays for itself quickly. When you stop accepting freight that does not cover your costs, your operating ratio improves even if your total revenue stays flat.
Key Takeaways
Load profitability reporting is the foundation of sustainable trucking margins because it connects every operational decision to actual cost data, not estimated rates.
| Point | Details |
|---|---|
| Use effective rate per mile | Divide gross revenue by loaded plus deadhead miles to get your true rate on every load. |
| Know your profit per mile thresholds | Target $0.50–$1.00 per mile; treat anything below $0.40 as a repricing trigger. |
| Score loads before acceptance | Evaluate deadhead, dwell risk, and destination quality before committing to any load. |
| Fix data fragmentation first | Integrate fuel, payroll, and settlement data into one system before building reports. |
| Review load performance monthly | Rank loads by net profit and replace or reprice the bottom performers every 30 days. |
Why most trucking owners are solving the wrong problem
I have worked with trucking companies across the Southeast that were running hard, moving freight every week, and still struggling to make payroll. When we dug into the numbers, the pattern was almost always the same: they were managing revenue, not profit. They knew their gross revenue per month. They knew their fuel bill. But they had no idea which loads were actually making money and which ones were quietly draining their margins.
The industry talks a lot about rate per loaded mile. That number feels concrete. It is easy to calculate and easy to compare. But it is the wrong anchor for profitability decisions. A carrier running at $2.80 per loaded mile sounds healthy until you factor in 200 miles of deadhead, a two-hour detention, and a fuel surcharge that did not cover actual pump prices. That load may have cost more to run than it returned.
What I have seen work is a shift in how owners and dispatchers think about their job. The dispatcher’s job is not to keep trucks moving. The dispatcher’s job is to keep trucks moving profitably. That sounds like a small distinction, but it changes every decision they make. When dispatchers have load-level profit data in front of them, they negotiate differently, they push back on low rates differently, and they plan routes differently.
The other thing I want to be direct about: you do not need a six-figure TMS to do this well. A well-organized accounting system, a consistent cost entry process, and a monthly review routine will get you most of the way there. The technology helps, but the discipline matters more. Carriers who build the habit of measuring profit per load, even manually at first, develop a financial instinct that no software can replicate.
If you are a trucking owner reading this and you cannot tell me which of your lanes made money last month and which ones did not, that is the problem worth solving. Everything else is secondary.
— Tony
How Truemeasureaccounting helps trucking companies gain load-level clarity
Trucking companies that want real financial clarity need more than basic bookkeeping. They need a financial partner who understands how loads, lanes, drivers, and costs connect to the bottom line.

Truemeasureaccounting works specifically with trucking and transportation businesses to build the financial reporting systems that make load-level profitability visible. From trucking bookkeeping services that capture costs at the load level to financial reporting that connects operational data to your P&L, the firm gives trucking owners the clarity they need to make better decisions every month. Schedule a free consultation to see how Truemeasureaccounting can help your fleet stop running on revenue and start running on profit.
FAQ
What is load profitability reporting in trucking?
Load profitability reporting is the process of calculating the true profit of each individual load by comparing gross revenue to all direct and allocated costs, including deadhead miles, fuel, driver pay, and fees. It gives trucking owners a clear picture of which freight is worth running.
What is a healthy profit per mile for trucking?
A healthy profit per mile falls in the $0.50–$1.00 range for most carriers. Values below $0.40 per mile indicate the load is not covering costs adequately and requires repricing or replacement.
Why is revenue per mile not enough to measure profitability?
Revenue per mile excludes deadhead costs, time exposure, and overhead allocation, which means it overstates true profitability. The Operating Ratio, which reconciles with your general ledger, is a more reliable profitability gauge at the load and lane level.
How does load scoring improve profitability decisions?
Load scoring ranks freight against your actual cost structure before acceptance, factoring in deadhead, dwell risk, and destination quality. This prevents dispatchers from accepting loads based on broker rates alone, which is one of the most common sources of margin loss in trucking.
How often should trucking companies review load profitability?
Monthly load-level profitability reviews are the standard for carriers who want to maintain healthy margins. Reviewing every 30 days gives you enough data to identify patterns and reprice or replace underperforming freight before losses compound.
Recommended
- Types of Trucking Business Expenses to Track in 2026
- Trucking P&L Made Simple: What Numbers Actually Matter for Profit – TrueMeasure Accounting LLC-Small Business Accounting Services
- Are You Pricing Your Trucking and Moving Services Right in 2025? – TrueMeasure Accounting LLC-Small Business Accounting Services
- Depreciation and Trucking Business Taxes: 2026 Guide