

The cash conversion cycle (CCC) measures how many days your cash sits tied up between paying for materials or inventory and collecting payment from customers. A shorter CCC means more cash on hand for payroll, equipment, and growth without borrowing to cover the gap. For inventory-heavy businesses like distributors and equipment dealers, it’s a core health metric; for pure labor service firms, it still matters, just through accounts receivable and job billing timing instead of inventory.
TL;DR:
- Reducing DSO through faster invoicing, like same-day billing and online payment options, can free up cash within one billing cycle.
- Improving inventory management by tightening reorder points and exploring just-in-time arrangements can cut DIO, but results take longer to materialize.
- Negotiating supplier payment terms carefully, aiming for 45 to 60 days, allows cash extension without damaging vendor relationships.
- Accurate, consistent bookkeeping and regular review of AR aging reports are essential to identify and fix cash flow issues early.
- Industry benchmarks vary widely: retail and distribution often run near zero or negative CCC, while manufacturing and construction typically see 60 to 90 days, so comparisons should focus on trends and peer performance.
Table of Contents
- What Is the Cash Conversion Cycle, and Who Needs to Track It?
- How Do You Calculate the Cash Conversion Cycle?
- What Drives Each Component, and Where Do Owners Get It Wrong?
- Is a Lower Cash Conversion Cycle Always Better?
- How Do You Actually Shorten the Cash Conversion Cycle?
- What Does a 90-Day CCC Improvement Plan Look Like?
- Why Most Owners Get Cash Conversion Backwards
- How TrueMeasure Accounting Turns Your CCC Into a Real Action Plan
- Sources
- FAQ
What Is the Cash Conversion Cycle, and Who Needs to Track It?
The cash conversion cycle tracks one thing: how long your money is stuck outside your bank account. It starts the day you pay for materials, inventory, or subcontractor labor, and it ends the day the customer’s payment clears. Everything in between, the job, the invoice, the collections call, is the operating cycle that CCC quantifies in days.
Not every business needs to obsess over this number the same way. A distributor sitting on a warehouse of parts lives and dies by inventory turns. An HVAC or plumbing contractor with light inventory but slow-paying commercial clients feels the pinch almost entirely through accounts receivable turnover instead. A trucking company feels it in the gap between fuel and driver pay going out weekly and freight invoices getting paid on 30 to 45 day terms.
Where CCC gets misused is when owners treat it as a standalone verdict on the business. It isn’t.
- CCC tells you how long cash is tied up, not whether the business is profitable.
- It needs to be read alongside your cash flow statement, not instead of it.
- A single month’s number means far less than a 12 month trend.
- Comparing your CCC to a different industry’s benchmark will mislead you badly.
Pair it with your monthly financial reporting, and CCC turns from an abstract ratio into an early warning system for cash crunches before they hit your checking account.
How Do You Calculate the Cash Conversion Cycle?
The formula is simple once you have three inputs:
CCC = DIO + DSO − DPO
Here’s what feeds each piece, with days calculated using a 365-day year:
- Days Inventory Outstanding (DIO) = (Average Inventory ÷ Cost of Goods Sold) × 365. This measures how long inventory sits before it sells.
- Days Sales Outstanding (DSO) = (Average Accounts Receivable ÷ Total Credit Sales) × 365. This measures how long it takes customers to pay after a sale or completed job.
- Days Payable Outstanding (DPO) = (Average Accounts Payable ÷ Cost of Goods Sold) × 365. This measures how long you take to pay your own suppliers.
Pro Tip: Use average balances (beginning plus ending, divided by two) rather than a single point-in-time snapshot. A December 31 inventory count after a slow season will understate DIO and hand you a falsely rosy CCC.
Here’s a worked example for a mid-size electrical contractor. Say average inventory runs $80,000 against annual COGS of $600,000, average receivables sit at $150,000 against $1.2 million in credit sales, and average payables run $70,000 against that same $600,000 COGS.
- DIO = (80,000 ÷ 600,000) × 365 = 48.7 days
- DSO = (150,000 ÷ 1,200,000) × 365 = 45.6 days
- DPO = (70,000 ÷ 600,000) × 365 = 42.6 days
- CCC = 48.7 + 45.6 − 42.6 = 51.7 days
That means roughly 52 days of cash is locked up between paying for materials and getting paid for the job. Shave five days off DSO through faster invoicing, and CCC drops to about 46.7 days, freeing up real cash without a single new sale. Also confirm your COGS and sales figures cover the exact same period as your balance-sheet averages; mismatched periods distort every day of the result.
What Drives Each Component, and Where Do Owners Get It Wrong?
DIO usually comes down to three things: how long your suppliers take to deliver, how wide your SKU or material mix is, and how disciplined your reorder policy is. A plumbing company stocking every fitting “just in case” will always carry a longer DIO than one that standardizes parts and orders on a tighter cycle. Convert raw inventory turnover into days by dividing 365 by the turnover ratio if that’s the number your reports already show.

DSO is almost always a process problem before it’s a customer problem; using AI for agencies can help automate and reduce administrative friction, speeding up collections and improving AR workflows. Slow payment often traces back to unclear contract terms, invoices that go out days after the job finishes, or billing errors that trigger disputes and delay payment while the customer waits for a correction. Fixing the upstream process, not chasing harder, is usually what actually closes the gap.
DPO is the one lever that cuts both ways. Stretching payment terms with suppliers keeps cash in your account longer, but push too far and you risk losing early-pay discounts or straining a supplier relationship you’ll need during a busy season. The goal is negotiated terms that work for both sides, not maximum delay.
A few measurement pitfalls trip up even experienced owners:
- Mixing cash-basis bookkeeping with accrual-based CCC formulas produces numbers that don’t reconcile.
- Including non-trade payables (like equipment loans) in the DPO calculation inflates the number artificially.
- Using a period for COGS that doesn’t match the balance-sheet snapshot for inventory and payables.
- Forgetting seasonal swings can distort comparisons.
Clean, consistent bookkeeping is essential for meaningful CCC calculations.
Is a Lower Cash Conversion Cycle Always Better?
Lower is usually better, but the number only means something in context. A construction firm running a 65 day CCC isn’t necessarily worse off than a trucking company running 20 days; they’re different businesses with different capital structures. What matters more is the direction your own CCC is moving and how it compares to close peers in your trade, not a generic benchmark pulled from an unrelated industry.
Some rough starting points by business type:
- Retail and distribution: often runs near zero or even negative, since customers pay upfront while supplier terms extend 30 to 60 days.
- Manufacturing and construction: commonly runs 60 to 90 days or more, driven by materials, labor, and progress billing delays.
- Service and trade contractors: typically fall between 30 and 60 days, dominated almost entirely by DSO rather than inventory.
A negative CCC can be a genuine strength, big-box retailers use supplier float as a financing tool. But a negative CCC built on stretching payables past what your suppliers will tolerate is a fragile version of the same trick, and it tends to break the first time a key vendor tightens terms. CCC varies enough by industry that trend analysis, paired with operating margin and cash flow trends, tells you far more than the standalone number ever will.
How Do You Actually Shorten the Cash Conversion Cycle?
Start with DSO. It’s almost always the fastest lever, and every day you shave off collections is a day of cash back in your account immediately. Inventory changes take longer to show results, and payable changes carry supplier relationship risk, so sequence your effort accordingly.
- Invoice the day the job finishes, not the day someone gets around to it. Delayed invoicing is the single most common self-inflicted DSO problem in trade businesses.
- Set up a payment portal or auto-pay option. Removing friction from the payment step routinely pulls several days out of DSO without any collections pressure at all.
- Require deposits or prepayments on larger jobs. A 30% to 50% deposit on materials-heavy jobs converts what would be 45 days of exposure into cash on day one.
- Consider invoice factoring selectively. It converts receivables to cash fast, but the fee eats into margin, so reserve it for genuine cash crunches, not as a permanent habit.
- Rationalize your SKU list and set real reorder points. Cutting slow-moving inventory and tightening reorder rules trims DIO without hurting job readiness.
- Explore just-in-time or consignment arrangements with key suppliers where your volume justifies it, particularly for high-cost equipment or specialty parts.
- Negotiate supplier terms deliberately, not defensively. Ask for 45 or 60 day terms on your largest accounts, and weigh any early-pay discount against your actual cost of holding cash.
Assign an owner to each change. Someone on your team needs to own the invoicing cutoff, someone owns the AR follow-up cadence, and someone owns the supplier conversation. Track it with simple KPIs: average days to invoice, average days to collect, and percentage of invoices over 30 days past due.
Pro Tip: Pilot one change at a time for 30 days before rolling out three at once. If you change invoicing timing, deposit requirements, and supplier terms simultaneously, you won’t know which change actually moved the number.
On effort versus payoff, DSO fixes are usually the cheapest to implement and the fastest to show results, often inside one billing cycle. Inventory changes take a full purchasing cycle or two to show up in the data. DPO renegotiation shows results immediately but carries the highest relationship risk, so treat it as the last lever you pull, not the first. A cash flow forecast built around these levers turns “we should collect faster” into a specific dollar number you can act on.
What Does a 90-Day CCC Improvement Plan Look Like?
Most owner-operated trade and service businesses can meaningfully move their CCC inside one quarter if they work the plan in order rather than trying everything at once.
Days 1 to 30: Clean up the data. You can’t fix what your books can’t measure accurately. Reconcile accounts receivable and payable balances, confirm inventory counts if you carry stock, and pull a clean trailing 12 month view of DSO, DIO, and DPO. This is also when you fix any billing errors sitting in dispute, because unresolved AR disputes quietly inflate your DSO every month they linger.
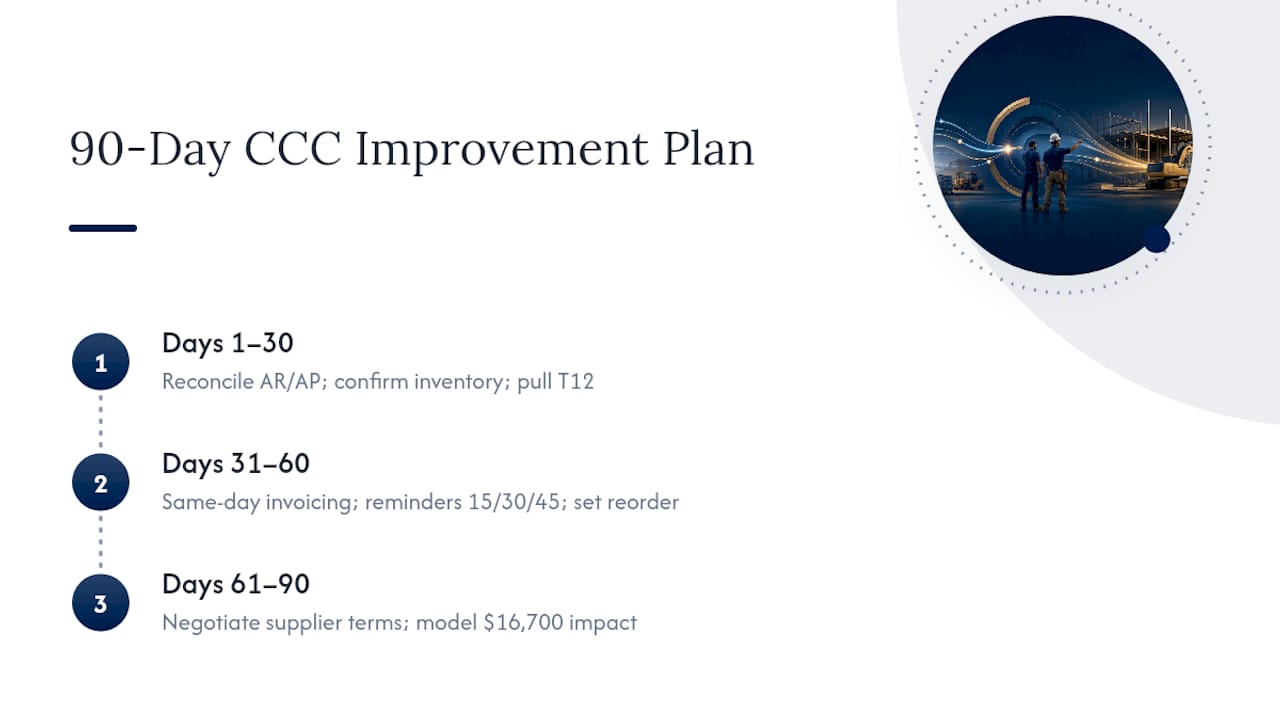
Days 31 to 60: Fix the AR workflow and invoicing timing. Move invoicing to same-day-as-completion. Set up a structured accounts receivable follow-up process with automatic reminders at 15, 30, and 45 days. If you carry inventory, tighten reorder points based on actual lead times rather than gut feel.
Days 61 to 90: Have the supplier conversation and run the numbers forward. Once your AR side is tighter, approach key suppliers about extended terms from a position of strength, not desperation. Then build a simple scenario: if DSO drops by five days on $100,000 in monthly credit sales, that’s roughly $16,700 in freed-up cash on hand, money that didn’t require a new customer or a loan.
Watch for signs you’ve outgrown DIY tracking: if you’re guessing at your DSO instead of pulling it from clean reports, or if cash feels tight despite a profitable P&L, that’s usually the point where ongoing bookkeeping support or a fractional CFO pays for itself several times over.
Why Most Owners Get Cash Conversion Backwards
Most owners chase profitability first and treat cash timing as an afterthought, something the bookkeeper handles in the background. That’s backwards. A profitable job on paper that doesn’t get paid for 60 days can sink a business faster than a mediocre job that gets paid in ten.
The mistake I see most often isn’t ignorance of the formula, it’s inertia around fixing the process behind it. Owners let a $4,000 invoice dispute sit unresolved for two months because chasing it feels awkward, meanwhile that single stuck invoice is dragging their DSO for the whole quarter. Or they’ll negotiate hard for a 2% early-pay discount from a supplier while sitting on $40,000 in overdue receivables, solving the wrong problem entirely.
Operator-focused reporting beats bookkeeping-only reporting because it asks a different question: not “is this recorded correctly,” but “what does this number tell me to do next.” Start with one habit: a 15 minute weekly check on your AR aging report and cash position. Owners who build that rhythm catch collection problems in week two instead of month two.
— Tony
How TrueMeasure Accounting Turns Your CCC Into a Real Action Plan
Calculating your cash conversion cycle is the easy part. Fixing the process behind it, without breaking supplier relationships or losing customers over aggressive collections, is where most owners get stuck. TrueMeasure Accounting exists for exactly that gap: we build the clean financial reporting that makes your DIO, DSO, and DPO trustworthy, then turn that data into a specific plan for your business instead of a generic checklist.
Our monthly bookkeeping services give you the accurate, reconciled numbers a real CCC calculation depends on, no guessing at average inventory or receivables balances. From there, our fractional CFO engagements map directly to the levers covered above: tightening your AR workflow, building cash flow forecasts that model a five or ten day DSO improvement before you commit to it, and negotiating supplier terms with real numbers behind the ask. Clients often gain clearer forecasts and improved collections within a few months. If your business is generating between $250,000 and $5 million a year and cash feels tighter than your profit and loss statement suggests, reach out to TrueMeasure Accounting and let’s map your CCC to a real 90-day plan.
Sources
- Understanding & Optimizing Your Cash Conversion Cycle (CCC)
- Cash Conversion Cycle: Formula and How to Reduce It | Billtrust
FAQ
What Is the Cash Conversion Cycle Formula?
CCC equals Days Inventory Outstanding plus Days Sales Outstanding minus Days Payable Outstanding, calculated as CCC = DIO + DSO − DPO using average balance-sheet figures.
Is a Higher or Lower Cash Conversion Cycle Better?
A lower CCC is generally better because it means cash returns to your account faster, but the right number depends heavily on your industry and business model, so compare it against your own trend and close peers rather than a universal target.
What Are the Three Main Components of the Cash Conversion Cycle?
The three components are Days Inventory Outstanding (how long inventory sits before selling), Days Sales Outstanding (how long customers take to pay), and Days Payable Outstanding (how long you take to pay suppliers).
What Is a Good CCC Ratio?
There’s no single universal number; retail and distribution businesses often run near zero or negative, manufacturing and construction commonly run 60 to 90 days, and trade or service contractors typically fall between 30 and 60 days, so judge your CCC against your own trend and industry peers.
How Often Should I Check My Cash Conversion Cycle?
Review your DSO and cash position weekly, and calculate the full CCC monthly alongside your other financial reporting, since a single stale number hides problems that a 15-minute weekly check would catch early.