

Eight metrics decide whether a property management operation is winning or quietly losing money: occupancy, collection rate, net operating income, operating expense ratio, average days vacant, renewal rate, turnover cost, and maintenance response time. Each one feeds directly into net operating income, and NOI is what determines what an owner’s asset is actually worth at sale. Track these on the right cadence, and the rest of this guide becomes your implementation plan.
TL;DR:
- Tracking occupancy, collection rate, and net operating income monthly is essential to identify financial trends and avoid cash flow issues.
- Separating physical occupancy from economic occupancy provides a clearer picture of cash flow health and potential delinquency risks.
- Prioritizing quick response times for maintenance requests and vendor performance directly influences tenant satisfaction and renewal rates.
- Maintaining accurate, timely, and consistent financial records ensures KPIs reflect true property performance and support reliable decision-making.
- Focusing on a small set of key metrics tailored to portfolio size prevents KPI programs from becoming overwhelming and losing effectiveness.
Table of Contents
- What Property Management KPIs Should You Track First?
- Financial KPIs: NOI, Collection Rate, and Expense Ratio Explained
- Leasing KPIs: Occupancy, Days Vacant, and Renewal Rate
- Operational KPIs: Maintenance Response and Vendor Performance
- Reporting Cadence: What to Review Daily, Weekly, and Monthly
- How to Prioritize KPIs for Your Portfolio
- Why Clean Books Are the Foundation of Reliable KPIs
- Tracking Capital Expenditure (CapEx) Without Losing the Thread
- Compliance and Risk Management KPIs Property Managers Can’t Skip
- Talking KPIs With Owners
- Get KPI Dashboards You Can Actually Trust
- Sources
- FAQ
What Property Management KPIs Should You Track First?
Before building dashboards or owner reports, get the baseline scorecard right. Some of these numbers need daily eyes; others only matter when reviewed over a quarter. Mixing up the cadence is how managers end up staring at noise instead of signal.
- Physical occupancy rate — occupied units divided by total units, checked weekly.
- Economic occupancy rate — actual collected rent divided by potential gross rent, reviewed monthly. This is the diagnostic cousin of physical occupancy.
- Collection rate — rent collected versus rent billed, tracked daily during the first five days of the month.
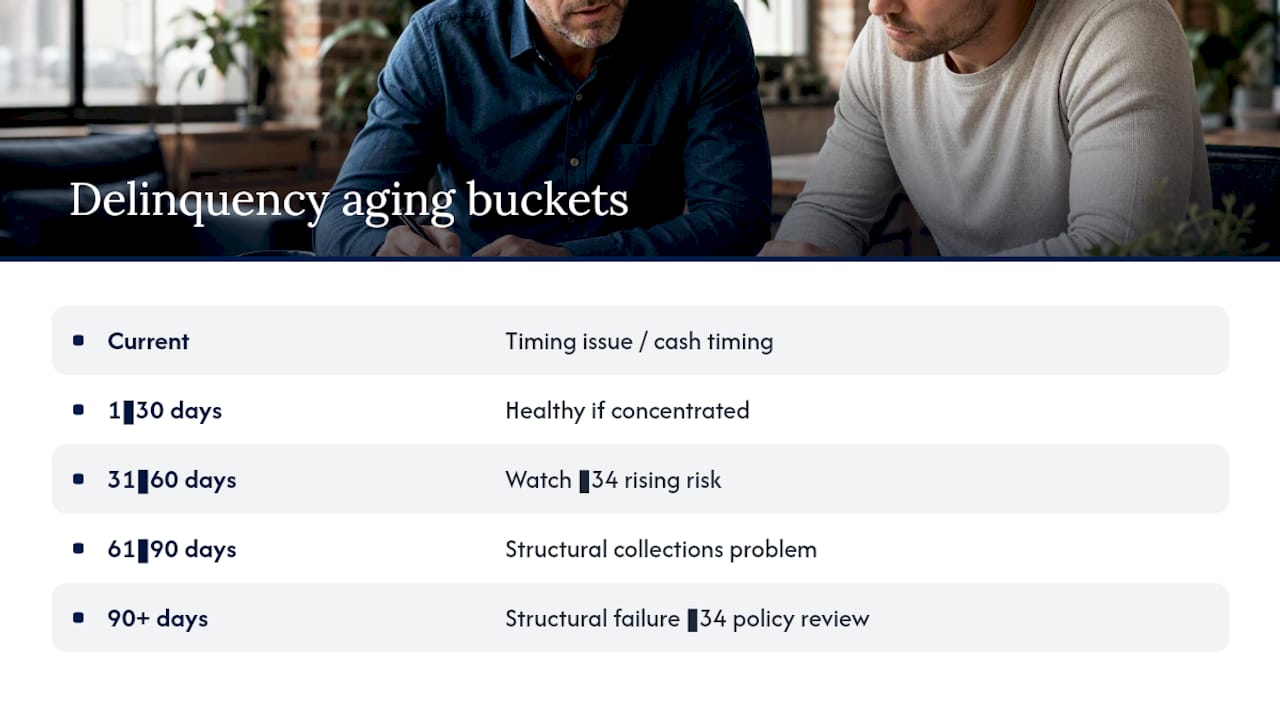
- Delinquency aging — outstanding balances sorted into 1 to 30, 31 to 60, 61 to 90, and 90-plus day buckets, reviewed weekly.
- Net operating income (NOI) — income minus operating expenses, reviewed monthly and trended quarterly. Headline metric.
- Operating expense ratio — operating expenses divided by effective gross income, reviewed monthly.
- Average days vacant — days between move-out and move-in, tracked per unit turn.
- Tenant renewal rate — renewals divided by lease expirations, tracked quarterly.
- Turnover cost per unit — total cost to re-tenant a unit, tracked per turn and rolled up quarterly.
- Maintenance response time — split into acknowledgment, first-touch, and completion, tracked daily.
- First-time fix rate — percentage of work orders closed on the first visit, tracked monthly.
- Cash flow margin — cash generated after debt service and CapEx reserves, reviewed monthly.
NOI, occupancy, and collection rate are headline numbers owners ask about. The rest are diagnostic. They tell you why the headline number moved, which matters more than the number itself once something goes wrong.
Financial KPIs: NOI, Collection Rate, and Expense Ratio Explained
Net operating income is effective gross income minus operating expenses, before debt service and capital expenditures. It is the single number that most directly sets a property’s market value, and that relationship is not abstract.
Consider a property generating $10,000 monthly NOI on a 6% cap rate. That property is worth roughly $2 million. Add $500 a month in NOI, through faster leasing or tighter expense control, and the property’s value rises by roughly $100,000 at the same cap rate. That is the math every owner conversation should be built around: small monthly moves compound into real equity.
Collection rate deserves two different measurements, not one. Track on-time collection by day 5 of the month for cash flow planning, and track total collection by month-end for a true delinquency picture. When the day-5 number drops but month-end recovers, that is a timing problem, usually late-paying tenants who eventually pay. When both numbers drop together, that is a screening or enforcement problem, and it needs a different fix.
Delinquency by the numbers: Reporting past-due balances in aging buckets, current, 1 to 30, 31 to 60, 61 to 90, and 90-plus, shows whether the portfolio has a short-term cash timing issue or a structural collections failure. A portfolio with most delinquency in the 1 to 30 bucket is healthy. One with balances piling up past 60 days needs a policy review, not just a phone call.
The operating expense ratio divides total operating expenses by effective gross income. Separate controllable spend (maintenance, marketing, staffing) from noncontrollable spend (property taxes, insurance) so you know which lever to pull when the ratio climbs. Protecting NOI usually comes down to three actions: cutting vacant days, negotiating vendor contracts before renewal, and tightening tenant screening so delinquency and turnover both fall.
Leasing KPIs: Occupancy, Days Vacant, and Renewal Rate
Physical occupancy counts units filled. Economic occupancy counts dollars collected against dollars possible. A property can show 96% physical occupancy while sitting at 88% economic occupancy because two tenants are months behind on rent. Report both, because owners who see only physical occupancy get blindsided by a cash flow problem hiding in plain sight.
Average days vacant breaks into three components, and each one has a different fix:
- Turn time — how long it takes maintenance to make a unit rent-ready after move-out. Standardize turn checklists and pre-order common materials to compress this.
- Marketing time — how long the unit sits listed before an application is signed. Professional photography and syndicated listings shorten this window meaningfully.
- Decision and paperwork time — how long from accepted application to signed lease and keys handed over. Digital lease signing usually cuts this to a day or two.
Turnover cost per unit adds lost rent during vacancy, marketing spend, cleaning and repair costs, and leasing commissions. Run that math before assuming a renewal at a modest increase is the weaker option. A $50 rent bump on a renewal almost always beats a new lease once turnover cost is factored in, even when a new tenant might pay $100 more. Industry guidance recommends marketing units 45 to 60 days before lease expiration and responding to showing requests within hours, not days, since inquiry-to-lease speed is one of the most controllable levers a manager has over vacancy.
Operational KPIs: Maintenance Response and Vendor Performance
Maintenance is where tenant satisfaction is won or lost, and it is measurable in three distinct stages rather than one blurry average.
- Acknowledgment time — how fast a work order is confirmed received. Target under 2 hours for standard requests, under 30 minutes for anything flagged urgent.
- First-touch time — how fast a technician or vendor actually shows up. Target within 24 to 48 hours for routine issues, same-day for emergencies like no heat or active leaks.
- Completion time — how fast the ticket closes. Target 3 to 5 business days for routine work.
- First-time fix rate — the share of tickets closed on the first visit without a callback. This should sit above 80% for a well-run vendor network.
- Vendor invoice accuracy — how often vendor billing matches the scope and quote approved, checked monthly.
Pro Tip: Don’t just watch your average response time. Watch the tail: the percentage of tickets still open past your target window. A portfolio can show a great 2-day average while a hidden 8% of tickets sit open for two weeks, and those are exactly the tickets generating one-star reviews and non-renewals. Averages hide the problem; the tail exposes it.
Vendor performance is its own KPI set worth tracking separately from internal response time, since a slow vendor can wreck an otherwise well-run maintenance program.
Reporting Cadence: What to Review Daily, Weekly, and Monthly
Not every KPI deserves the same attention frequency. Report a slow-moving number too often and you create noise. Report a fast-moving number too rarely and you miss the window to act. The actionability rule is simple: match the reporting frequency to how quickly you can actually do something about the number.
- Daily: new delinquencies, emergency work orders, vacant units with no scheduled showings.
- Weekly: occupancy trend, showing activity, applications in process, maintenance ticket aging.
- Monthly: collection rate, NOI, operating expense ratio, renewal rate, owner financial statement.
- Quarterly: NOI trend versus prior quarters, capital expenditure planning, turnover cost analysis, lease expiration forecasting.
A monthly owner statement should include income and expenses against budget, a delinquency aging summary, occupancy for the period, a summary of completed and pending maintenance, and any capital items approved or pending. Every property, regardless of size, should carry this as the minimum standard. Owners do not need forty fields. They need the same six or eight fields, every month, consistently formatted, so a two-minute glance tells them exactly where the property stands.
How to Prioritize KPIs for Your Portfolio
Chasing every metric on this list at once is how KPI programs die within three months. Prioritize based on portfolio size and what the owner actually cares about.
- Small portfolios (under 20 units): focus on occupancy, collection rate, and maintenance response time. These three catch 80% of the problems that will surface, and a small team can track them without dedicated software.
- Mid-size portfolios (20 to 200 units): add NOI, operating expense ratio, and turnover cost per unit. At this scale, expense creep and turnover costs start eating margin in ways that are invisible unit by unit but visible in aggregate.
- Large portfolios (200-plus units): add renewal rate trending, vendor performance scoring, and quarterly capital planning tied to NOI trend. At this size, benchmarking against prior periods matters more than any single month’s number.
For every KPI you adopt, set a target range rather than a single number, and review trend over time rather than reacting to one bad month. A single vacant unit can swing a small portfolio’s occupancy rate by several points; that is noise, not signal, until the trend confirms it.
Why Clean Books Are the Foundation of Reliable KPIs
None of these numbers mean anything if the underlying books are wrong. NOI calculated from a chart of accounts that misclassifies capital repairs as operating expenses will mislead every owner conversation you have. A disciplined monthly close, categorized correctly and reconciled on schedule, is what makes a KPI dashboard trustworthy rather than decorative.
This is where setting up accounting correctly from the start pays off, and where fractional CFO advisory earns its keep: turning a KPI trend into a pricing decision, a capital reserve plan, or a vendor renegotiation, instead of leaving it as a number nobody acts on.
Tracking Capital Expenditure (CapEx) Without Losing the Thread
CapEx tracking gets mishandled two ways: either it gets buried inside operating expenses (which understates NOI’s true operating performance) or it gets tracked so loosely that owners have no idea what is coming next year. Neither serves the relationship.
Separate CapEx into three categories. Planned replacements cover roofs, HVAC systems, and major appliances on a known life cycle, budgeted years ahead. Emergency capital repairs are unplanned but capital in nature, a burst pipe requiring wall reconstruction rather than a simple patch. Value-add improvements are discretionary upgrades meant to support a rent increase or reposition a unit, and these need their own return-on-investment math before approval.
Track CapEx per unit per year as a rolling figure, not just a lump sum per project. A property averaging $800 per unit annually in capital spend tells a very different maintenance story than one averaging $3,000. That per-unit trend line is often more revealing to an owner than the raw dollar total, because it normalizes across portfolios of different sizes.
Keep a capital reserve schedule tied to the age and condition of major systems, and review it quarterly alongside NOI trend. Owners who see CapEx planned three years out make better decisions than owners who get surprised by a $15,000 roof replacement with no warning. The KPI here isn’t just spend, it’s predictability of spend, and that predictability is what keeps an owner’s trust intact through a rough capital year.
Compliance and Risk Management KPIs Property Managers Can’t Skip
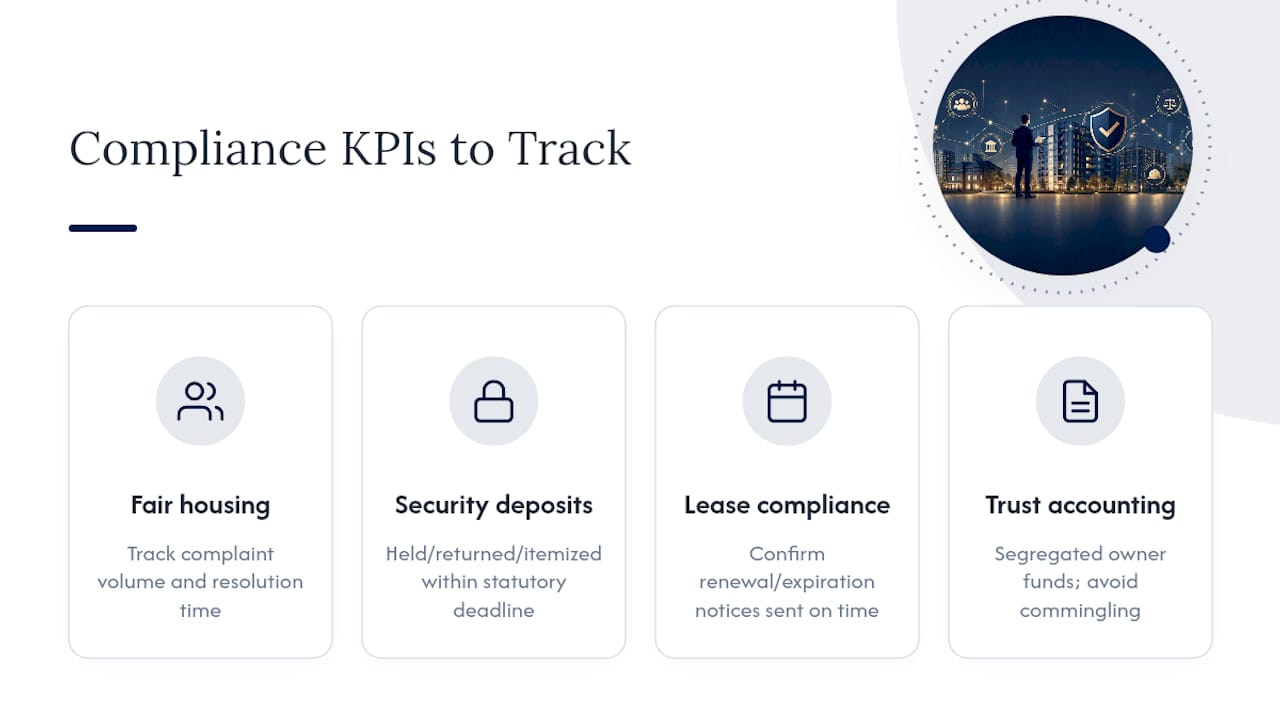
Compliance failures rarely show up as a line item until they become a lawsuit, a fine, or a lost management contract. That makes risk KPIs different from the rest of this list: they are lagging indicators of a mistake instead of leading indicators of performance, which is exactly why they get ignored until something breaks.
Track fair housing complaint volume and resolution time, even at zero, since a documented tracking process matters if a dispute ever escalates. Track security deposit compliance, meaning deposits held, returned, or itemized within your state’s statutory deadline, because missed deadlines routinely trigger penalty damages regardless of whether the underlying deduction was fair. Track lease renewal and expiration compliance, confirming required notices went out on time, and insurance certificate currency for every vendor working on the property, since an expired vendor certificate turns a routine repair into an uninsured liability exposure.
Trust accounting compliance belongs on this list too. Owner funds and security deposits held in the wrong account, or commingled with operating cash, is one of the fastest ways a management company loses its license. A clean trust accounting process isn’t a nice-to-have compliance formality; it’s the difference between an audit that takes an afternoon and one that takes a lawyer.
Review these KPIs quarterly at minimum, and immediately after any incident. A single missed insurance renewal or one mishandled deposit can cost more than a full year of the maintenance and leasing gains the rest of this scorecard tracks.
Talking KPIs With Owners
Owners don’t care about occupancy percentages. They care about what their property is worth and how much cash it throws off. Every KPI conversation should end in an NOI or valuation sentence, not a metrics recap. Watch for vanity numbers, a great average response time hiding a bad tail, and push instead for cadence that matches how fast you can actually act. Automate the routine monitoring. Invest the saved time in a tighter monthly close.
— Tony
Get KPI Dashboards You Can Actually Trust
Every KPI in this guide is only as good as the books behind it. If your monthly close is late, miscategorized, or reconciled quarterly instead of monthly, your NOI and expense ratio numbers are guesses dressed up as data, and no dashboard software fixes that at the source. Truemeasureaccounting builds the accounting foundation first, then turns it into owner-ready reporting and KPI tracking that actually holds up under scrutiny.
That means monthly bookkeeping and reconciliations done on a schedule, financial reporting built around the metrics owners actually ask about, and fractional CFO advisory when a KPI trend needs to turn into a pricing or capital decision. Plans start at $265 a month with the Essentials tier, scaling to Plus and Premium as your portfolio and reporting needs grow, with fixed pricing instead of hourly billing so you know the cost before you commit. If your books need a cleanup before KPIs will even calculate correctly, start with bookkeeping services and build from there.
Sources
For deeper benchmarking, consult the Census Bureau’s housing vacancy data, NARPM’s financial performance guide, and operational KPI research from Pulse RevOps.
- Pulse RevOps — Industry KPIs for property management
FAQ
What are the 5 key performance indicators for property managers?
Most operators start with occupancy rate, collection rate, net operating income, average days vacant, and maintenance response time. These five catch the majority of financial and operational problems before they compound.
What are top 3 KPIs to check first if you’re short on time?
Occupancy rate, collection rate, and NOI. Occupancy and collection drive revenue, and NOI shows whether expenses are eating the gains those two are producing.
What are the most important performance goals for a property manager?
Beyond the numeric KPIs, the underlying goals are maximizing occupancy, protecting collections through disciplined delinquency management, controlling operating expenses, and keeping maintenance response fast enough to drive renewals over turnover.
How often should property management KPIs be reported to owners?
Monthly, at minimum, with a standard statement covering income against budget, delinquency aging, occupancy, and maintenance activity. Quarterly reviews should add NOI trend and capital planning.
Can accounting software alone produce reliable property management KPIs?
Software can calculate KPIs correctly only when the books feeding it are accurate and reconciled on schedule. A disciplined monthly close, not just a subscription to reporting software, is what makes the resulting KPI dashboard trustworthy.