
Employee profitability tracking is the process of measuring each employee’s financial contribution against their total cost to the business. In service industries, where labor is the largest expense, this measurement is the difference between knowing your margins and guessing at them. The formal term used in workforce analytics is employee ROI analysis, and it goes well beyond watching hours worked. Data-driven performance measurement makes companies 4.2 times more likely to outperform industry peers financially. That number alone should change how you think about your payroll data.
What are the essential metrics for employee profitability tracking?
The foundation of any workforce profitability assessment is the employee ROI formula: (Economic Impact minus Total Employee Costs) divided by Total Employee Costs, multiplied by 100%. Total costs must include salary, bonuses, payroll taxes, benefits, workspace, software licenses, and training. Most service business owners only count the base wage. That gap in cost capture is where profitability analysis breaks down before it even starts.
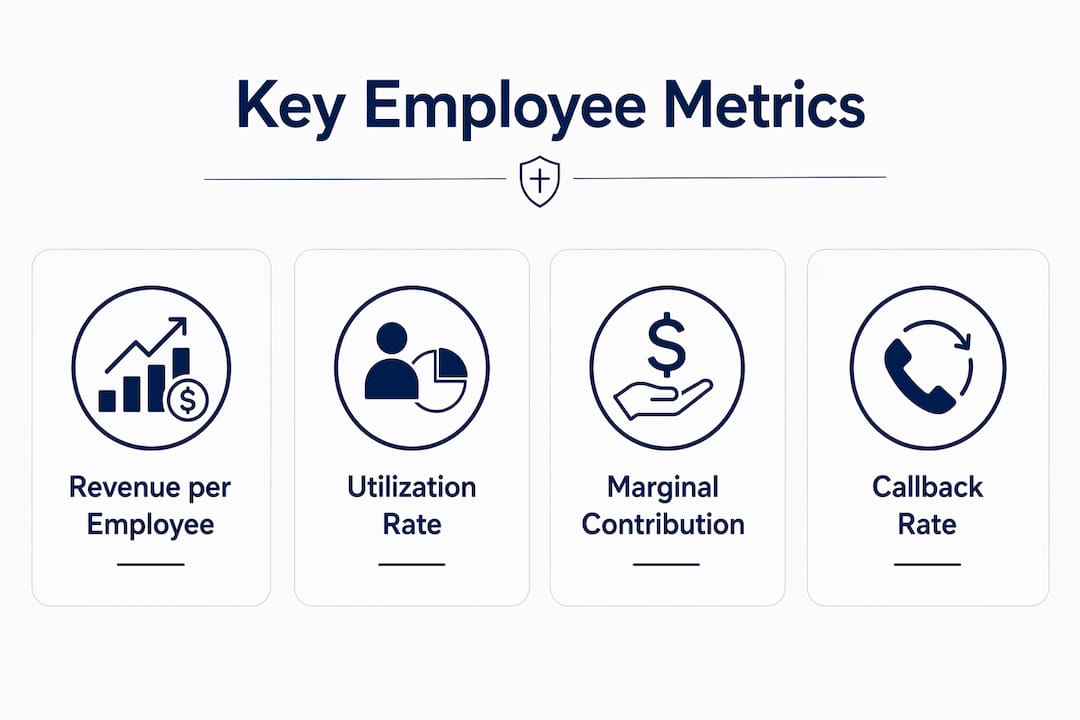
Revenue per employee
Revenue per employee is the simplest starting point. Divide total revenue by the number of full-time equivalent employees. This gives you a baseline for comparing performance across your team and against industry benchmarks. A technician generating $180,000 in annual revenue looks different from one generating $95,000 when both carry the same $65,000 fully loaded cost.

Utilization rate
Utilization rate measures the percentage of paid hours that are billable or directly revenue-generating. An HVAC technician paid for 40 hours per week who logs 28 billable hours has a 70% utilization rate. The remaining 30% covers drive time, callbacks, and administrative work. That non-billable time still costs you money, and it must factor into your profitability calculation.
Marginal contribution per employee
Marginal contribution is the revenue an employee generates minus the direct variable costs tied to their work, such as materials, subcontractors, and job-specific expenses. This metric tells you how much each person actually adds to your gross profit before overhead. It is the clearest signal of who is carrying the business and who is consuming it.
Here is a summary of the core metrics and how to calculate them:
| Metric | Formula | What It Tells You |
|---|---|---|
| Revenue per employee | Total revenue ÷ FTE count | Overall productivity baseline |
| Employee ROI | (Economic impact − Total cost) ÷ Total cost × 100% | Net financial return per employee |
| Utilization rate | Billable hours ÷ Total paid hours × 100% | Efficiency of time allocation |
| Marginal contribution | Revenue − Direct variable costs | Gross profit contribution per person |
| Cost-to-revenue ratio | Total employee cost ÷ Revenue generated | Labor cost efficiency |
Pro Tip: Track utilization rate monthly, not annually. A technician who is 90% utilized in summer and 40% in winter needs a different conversation than your annual average suggests.
Measuring employee performance accurately also requires looking beyond pure financial output. Top performance metrics recommended for 2026 include employee engagement, goal achievement rate, and adaptability alongside productivity efficiency. These qualitative inputs prevent you from misreading a high-revenue employee who is burning out or a lower-revenue employee who is building long-term client relationships.
How do integrated data systems improve accuracy in profitability analysis?
Fragmented systems are the single biggest cause of inaccurate labor cost data in service businesses. When your time tracking app does not talk to your payroll software, and your payroll software does not connect to your job costing records, you are building profitability reports on incomplete information. Failing to integrate timesheets with payroll and job costing causes 10–20% of true labor costs to go unrecorded. That is not a rounding error. That is a pricing problem waiting to happen.
The cost of data silos
Consider a plumbing company with six technicians. Each tech logs hours in a field app. The office manager manually enters those hours into payroll. Job costs get recorded separately in a spreadsheet. By the time the numbers reach the income statement, admin time, drive time, and warranty callbacks are either missing or miscategorized. The result is an inflated gross margin that makes the business look more profitable than it actually is.
Unified digital environments prevent data silos and eliminate the manual errors that distort profitability reporting. When timesheets, payroll, and job costs flow into a single system automatically, you get a complete picture of what each job and each employee actually costs.
Here is how cost capture compares with and without integration:
| Cost Category | Without Integration | With Integration |
|---|---|---|
| Direct labor hours | Partially captured | Fully captured per job |
| Admin and non-billable time | Often missing | Allocated to overhead |
| Warranty and callback labor | Rarely tracked | Logged and costed |
| Training time | Not recorded | Included in total cost |
| Software and tool costs | Estimated | Assigned per employee |
Pro Tip: Before buying new software, map your current data flow on paper. Identify exactly where hours, costs, and revenue get recorded separately. That map shows you where your profitability data is leaking.
The workflow that works best for most service businesses connects field time tracking directly to job records, which then feed payroll and financial reporting. Accounting for all paid hours, including training and administrative time, is necessary for true profitability insights. Ignoring non-billable hours skews your data and leads to underpricing your services.
- Connect field time tracking to job records in real time
- Assign overhead costs to employees using a consistent allocation method
- Reconcile payroll to job cost reports monthly, not quarterly
- Flag unassigned hours weekly so they get categorized before month-end close
What are common pitfalls when measuring employee performance for profitability?
The most common mistake service business owners make is treating time tracking as profitability tracking. They are not the same thing. Tracking time without connecting it to outcomes distorts employee contribution insights and rewards busyness over real value. A technician who logs 45 hours a week but generates callbacks, warranty claims, and customer complaints costs more than their timesheet shows.
Workforce analytics is not surveillance. It is a tool for uncovering capacity constraints, improving resource allocation, and making better pricing decisions. The goal is clarity, not control.
The single-score trap
Reducing an employee’s value to one number is a mistake that oversimplifies employee contribution and misses skill gaps and qualitative strengths. A dispatcher who keeps your trucks running efficiently may show low direct revenue but saves you thousands in fuel and overtime. A sales-focused technician may generate high revenue while leaving behind quality problems that cost you clients. Single scores hide these dynamics.
Hidden costs that distort your data
Several cost categories routinely get left out of employee profitability calculations in service businesses:
- Onboarding and training costs: A new HVAC technician may cost $3,000–$5,000 to train before generating a single billable hour.
- Supervision time: Senior technicians who mentor junior staff carry a portion of that mentoring cost against their own profitability.
- Callbacks and warranty work: Labor on callbacks is a real cost that must be assigned back to the original job and employee.
- Administrative support: The time your office staff spends scheduling, invoicing, and following up for a specific technician is part of that technician’s total cost.
Morale and transparency
Transparency about which KPIs affect evaluation and how they connect to financial outcomes builds trust and improves motivation. Employees who understand the metrics feel less surveilled and more engaged. One practical approach: allow employees to view their own productivity data before management reviews it. This creates a culture of self-improvement rather than policing, and it reduces the resentment that kills retention.
A hybrid approach combining quantitative metrics with qualitative inputs delivers a more complete and accurate profitability picture. Revenue generated, utilization rate, and callback rate give you the numbers. Client satisfaction scores, peer feedback, and quality audits give you the context.
How can you apply profitability data to improve operational decisions?
Profitability data is only useful when it changes a decision. Here is how to put it to work in a service business:
-
Redistribute workload based on utilization data. If two technicians are consistently over 90% utilized while two others sit at 55%, you have a capacity imbalance. Reassigning job types or territories can improve both efficiency and employee satisfaction without adding headcount.
-
Adjust pricing based on true labor costs. If your fully loaded cost per technician hour is $68 and you are billing at $85, your margin is thinner than it looks once you factor in non-billable time. Profitability data gives you the evidence to raise rates with confidence.
-
Build incentive programs around margin, not just revenue. A technician who sells $200,000 in services but generates $40,000 in callbacks and warranty claims is less profitable than one who sells $140,000 cleanly. Tie bonuses to net margin contribution, not gross revenue.
-
Identify your most profitable service lines by employee. Some technicians excel at complex commercial jobs with high margins. Others are faster on residential calls with lower margins but higher volume. Matching people to the work they do best improves your overall profitability without changing your pricing.
-
Use profitability data in capacity planning. Before hiring, calculate whether your current team’s utilization rate justifies the cost of a new employee. If your team averages 65% utilization, you likely have capacity to grow revenue without adding labor costs.
Pro Tip: Run a profitability report by employee at least quarterly. Compare it to your pricing model. If your top performer is generating a 12% net margin and your pricing assumes 20%, your rates need to change, not your people.
Companies using advanced productivity analytics experience an average 22% performance increase. That gain comes from making better decisions with better data, not from working harder. Continuous feedback and regular measurement outperform annual reviews, with 92% of employees preferring more frequent feedback. Quarterly profitability reviews paired with regular one-on-one conversations create accountability without creating anxiety.
The bookkeeping foundation for profitability analysis matters more than most business owners realize. Accurate books are the prerequisite for accurate employee profitability data. Without clean financials, every metric you calculate is built on a shaky foundation.
Linking profitability insights to your financial reporting process turns monthly numbers into monthly decisions. When your reports show you which employees, service lines, and clients are generating real margin, you stop managing by gut feel and start managing by fact.
Key takeaways
Employee profitability tracking works when you measure total cost against real financial contribution, integrate your data systems, and use the results to make specific operational decisions.
| Point | Details |
|---|---|
| Use the full cost formula | Include salary, taxes, benefits, training, and overhead in every employee cost calculation. |
| Integrate your data systems | Connect time tracking, payroll, and job costing to prevent 10–20% labor cost underreporting. |
| Avoid the single-score trap | Combine financial metrics with qualitative inputs for an accurate picture of employee value. |
| Apply data to pricing decisions | Use true labor costs to validate or adjust your billing rates with confidence. |
| Review profitability quarterly | Regular measurement and feedback outperform annual reviews and improve accountability. |
What I’ve learned from watching service businesses track the wrong things
I spent more than 20 years building and running service businesses before I started helping other owners with their finances. The most common pattern I saw was this: owners tracked hours religiously and had almost no idea whether those hours were profitable.
One electrical contractor I worked with had a technician everyone loved. Great attitude, never missed a shift, clients liked him. His revenue numbers looked fine on the surface. When we built out a full employee ROI analysis, including his callback rate, the warranty labor he generated, and the supervision time his work required, he was actually costing the business money on roughly one in three jobs. Nobody knew because nobody had connected the dots between his timesheet and his job-level outcomes.
The fix was not to fire him. The fix was to assign him to job types where his strengths matched the work, and to give him clear feedback on the specific behaviors driving the callbacks. Within two quarters, his profitability flipped. That only happened because the data made the problem visible.
The other thing I see constantly is owners who resist this kind of tracking because they think it will feel like surveillance to their team. That fear is understandable, but it is usually wrong. When you frame profitability tracking as a tool for clarity rather than a tool for control, and when you share the data with employees rather than hiding it from them, most people respond well. They want to know how they are doing. They want to understand what success looks like. Giving them that information is not threatening. It is respectful.
The businesses that get this right are not the ones with the most sophisticated software. They are the ones where the owner understands the numbers well enough to have honest conversations about them.
— Tony
Accurate books are the starting point for employee profitability analysis
Profitability analysis at the employee level requires clean, organized financial data as its foundation. Without accurate bookkeeping, your labor costs are miscategorized, your job costs are incomplete, and your profitability reports are unreliable.
Truemeasureaccounting works with owner-operated service businesses to build the financial infrastructure that makes this kind of analysis possible. From small business bookkeeping services to full profitability reporting by employee, job, and service line, the firm connects your financial data to the decisions that actually move your business forward. If you are ready to know exactly where your labor dollars are going and which employees are driving real margin, Truemeasureaccounting is built for that work.
FAQ
What is employee profitability tracking?
Employee profitability tracking is the process of measuring each employee’s financial contribution against their total cost, including salary, benefits, training, and overhead. The result tells you whether each person is generating a net positive return for the business.
How do I calculate employee ROI?
The employee ROI formula is: (Economic Impact minus Total Employee Costs) divided by Total Employee Costs, multiplied by 100%. Total costs must include all direct and indirect expenses tied to that employee.
What metrics matter most for tracking employee productivity in service businesses?
Revenue per employee, utilization rate, marginal contribution, and callback rate are the most relevant metrics for service businesses. Combining these financial metrics with qualitative inputs like client satisfaction gives a complete picture.
Why does data integration matter for workforce profitability assessment?
Disconnected systems cause 10–20% of true labor costs to go unrecorded. Integrating time tracking, payroll, and job costing into a unified system prevents cost underreporting and gives you accurate profitability data at the employee and job level.
How often should I review employee profitability data?
Quarterly reviews paired with monthly financial reporting give you enough frequency to catch problems early without creating unnecessary pressure. Regular measurement consistently outperforms annual reviews for both accountability and employee engagement.