

Customer profitability analysis measures what each customer actually contributes after every cost of serving them, not just the margin on what they buy — a key insight from customer feedback drives revenue growth strategies. The gap between the two is often where the money disappears. Run it correctly and you get a clear, prioritized list: which customers to protect, which to reprice, which to restructure, and which to walk away from.
TL;DR:
- Customer profitability analysis reveals that the gap between gross margin and actual contribution often ranges from 8% to 15%, highlighting unprofitable accounts.
- Calculating CM II by subtracting cost-to-serve from CM I can reduce a customer’s profitability from 32% to maybe just 8%, indicating potential margin leaks.
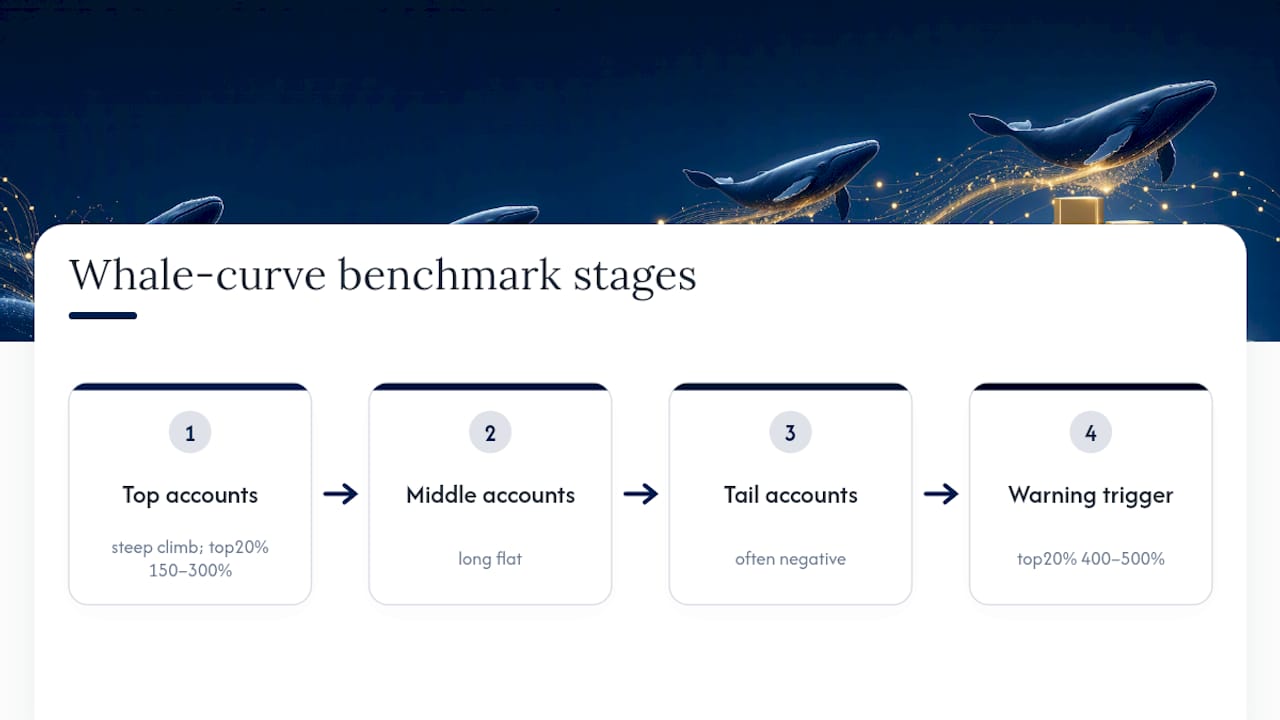
- The whale curve shows that roughly 20% of customers generate 150% to 300% of total profit, while the rest may be actively harming overall profitability.
- Implementing rate cards and activity-based costing can identify high-cost-to-serve drivers like order processing and delivery miles, guiding targeted pricing or restructuring.
- Starting with analysis of the top 20 customers often uncovers one or more accounts draining margin, providing quick opportunities for cash flow and cost recovery.
Table of Contents
- What Customer Profitability Analysis Reveals That Gross Margin Hides
- How to Calculate Customer Profitability: Formulas and Data You Need
- Cost-to-Serve Drivers: What to Measure and Where the Data Lives
- The Customer Profitability Matrix and Why the Whale Curve Matters
- Turning CPA Findings Into Pricing and Service Decisions
- Where Customer Profitability Analysis Goes Wrong
- How TrueMeasure Accounting Runs This With Trades and Trucking Clients
- Benchmarking Customer Profitability Against Industry Standards
- Ethics and Relationship Management When You Act on the Data
- Connecting CPA to Your CRM and ERP for Ongoing Tracking
- Software and Analytics That Make CPA More Accurate
- Factoring in Customer Lifetime Value and Strategic Relationships
- Run the Top 20 Analysis Before You Do Anything Else
- Let TrueMeasure Accounting Build Your Customer Profitability Model
- Sources
- FAQ
What Customer Profitability Analysis Reveals That Gross Margin Hides
Gross margin tells you what a customer’s invoices are worth. It says nothing about what it costs to keep serving them. That’s the blind spot customer profitability analysis closes, and it’s why two customers with identical product margins can land in completely different places once you account for how they actually behave.
Start with pocket revenue, the cash you actually keep after discounts, rebates, freight allowances, and early-payment terms erode the invoice total. For mid-market service businesses, that gap between list price and pocket revenue commonly runs 8% to 15%, which means the number on the invoice is routinely overstating what you’re really collecting.
From there, two contribution layers matter:
- CM I (Contribution Margin I): pocket revenue minus direct product or job costs. This is close to what most owners think of as gross margin.
- CM II (Contribution Margin II): CM I minus cost-to-serve, meaning order processing, delivery, returns, support calls, and the float cost of slow-paying customers.
A customer generating 32% CM I can easily drop to single digits, or negative, once cost-to-serve is subtracted. Wikipedia’s overview of customer profitability analysis notes that revenue ranking and profitability ranking often diverge sharply for exactly this reason. One more caveat worth flagging up front: CPA is retrospective. It tells you what happened last quarter, not what a customer is worth over the next five years, so pair it with customer lifetime value thinking before you make permanent decisions.
How to Calculate Customer Profitability: Formulas and Data You Need
Analyzing customer profitability doesn’t require an enterprise data warehouse. It requires disciplined data pulls and two formulas you can build in a spreadsheet before you need anything fancier.
Pull the following for a trailing 12 months, tagged by customer and, ideally, by customer-product or customer-job combination:
- Invoice-level revenue and any discounts, rebates, or credits applied
- Freight, packaging, and delivery charges paid or absorbed
- Direct product, material, or job costs
- Order count, line count, and delivery count per customer
- Return volume and dollar value
- Support hours or service calls logged per customer
- Days sales outstanding, to price in the cost of financing slow payers
The core formulas:
Pocket Revenue = Invoice revenue − discounts − rebates − freight absorbed − early-payment deductions
CM I = Pocket revenue − direct costs (materials, labor, subcontractor cost)
CM II = CM I − cost-to-serve (allocated using driver rate cards, covered next)
Building a rate card is simpler than it sounds: take a cost pool (say, total order-processing payroll for a quarter) and divide it by total order volume across all customers. That gives you a cost-per-order rate you apply to each account based on how many orders they actually placed.
A quick worked example: a customer generates $180,000 in annual revenue with 28% CM I, or roughly $50,400. But they place small orders weekly, return 6% of shipments, and pay on net 60 terms against your net 30 standard. Once order-processing, return-handling, and financing-cost drivers are applied, CM II might land closer to $8,000, a fraction of what the top-line margin implied.
You don’t need to analyze every account to get value from this. Start with your top 20 customers by revenue, which typically covers 60% to 80% of total revenue, then expand to the top 50. Aggregate the long tail into segments rather than analyzing each one individually.
Cost-to-Serve Drivers: What to Measure and Where the Data Lives
Cost-to-serve is the piece most owners underestimate, mainly because it’s scattered across systems that don’t talk to each other.
The common drivers worth tracking:
- Order volume and order-processing time (ERP or accounting system)
- Line items per order, which drive picking and invoicing labor (ERP)
- Delivery stops and mileage (routing software or shipping logs)
- Returns and the labor to process them (ERP plus warehouse logs)
- Site visits, truck rolls, and windshield time (CRM or dispatch software)
- Special handling: rush orders, custom specs, off-hours service (CRM notes, dispatch logs)
- Payment terms and days sales outstanding (accounting system)
Here’s a driver calculation in practice: if your dispatch team spends 400 hours a quarter processing service calls and you logged 2,000 calls, your cost-per-call rate is 0.2 hours, or roughly $14 at a $70 fully loaded hourly cost. A customer who called 40 times in a quarter carries $560 in dispatch cost alone, before a technician even shows up.
Pro Tip: Don’t wait for a perfect system before you start. A five-driver rate card covering orders, lines, deliveries, returns, and visits is usually enough to expose the worst offenders. Save time-driven activity-based costing, which tracks actual minutes per activity at the transaction level, for when you’re scaling past the point a simple rate card can handle.
The 8% to 15% revenue-to-pocket gap mentioned earlier usually compounds with cost-to-serve leakage, which is why the two effects together do far more damage than either one alone.
The Customer Profitability Matrix and Why the Whale Curve Matters
Once you have CM II by customer, plot revenue against cost-to-serve on a simple two-axis grid. This customer-profitability matrix sorts every account into one of four quadrants, and each quadrant calls for a different move:
- High revenue, low cost-to-serve (Protect): your best accounts. Lock them in, don’t nickel-and-dime them, and make sure your best people handle them.
- High revenue, high cost-to-serve (Reprice): valuable but expensive to keep. Renegotiate terms, add minimum-order thresholds, or streamline how you serve them.
- Low revenue, low cost-to-serve (Maintain): fine as-is, low effort required.
- Low revenue, high cost-to-serve (Exit or restructure): the quadrant doing the most damage. These accounts often survive purely on inertia.
Now plot cumulative profit against cumulative customers ranked from most to least profitable. That curve rises steeply, peaks, then often dips as unprofitable accounts drag the total back down. This is the whale curve, and Kaplan and Narayanan’s research found the most profitable roughly 20% of customers can generate between 150% and 300% of total profits, meaning your worst accounts are actively subtracting from the pool your best ones built. For trades and service firms, a practical threshold is flagging any account where cost-to-serve consumes a significant portion of CM I for deeper review.
Turning CPA Findings Into Pricing and Service Decisions
A profitability model that sits in a spreadsheet changes nothing. The value comes from sequencing action so you don’t blow up relationships or overcorrect.
- Model the fix before you touch a customer. Run the numbers on a price increase, a minimum-order fee, or a service-tier change against actual historical order patterns.
- Pilot with two or three accounts first. Test changes on a small set of leaking combinations before rolling out broadly, since most leaks respond to operational fixes rather than requiring you to fire the customer.
- Assign an owner and a KPI. Someone on your team owns each fix, with a specific margin or CM II target and a 90-day check-in.
- Communicate changes directly. A clear, professional price increase conversation preserves more relationships than a silent margin squeeze ever will.
For trades and trucking specifically: an HVAC company might add a minimum-order fee for service calls under $150. A distributor might start charging restocking fees on returns above a threshold. A trucking company might reprice rush-delivery lanes that currently run at cost because dispatch never flagged the mileage-to-revenue ratio. Repricing the highest cost-to-serve accounts is consistently the fastest lever, since even a 1% realized price increase moves operating profit disproportionately more than a 1% cost cut.
Pro Tip: A first-pass CPA typically finds 5% to 10% of revenue is fully-loaded unprofitable. That’s usually enough margin recovery to fund the analysis itself several times over, so don’t let a perfect model delay the first pilot.
Where Customer Profitability Analysis Goes Wrong
The biggest risk isn’t the math, it’s the allocation choices behind the math getting challenged, or worse, never getting documented in the first place.
Write down every driver definition and allocation rule before you present results. If sales asks why a customer’s cost-to-serve jumped, you need to point to the exact rate card and driver volume that produced it, not reconstruct your logic on the fly. A defensible model documents allocation choices and driver definitions clearly enough that ops, sales, and finance can all trace the number back to its source.
Watch for two specific data gaps: missing order-level detail (invoices batched at the customer level instead of the transaction level) and inconsistent SKU or job coding that makes cost-to-serve allocation unreliable. Small sample sizes are another trap. A single bad quarter for a long-standing customer shouldn’t trigger an exit decision.
Review the model quarterly, not annually. Customer behavior shifts faster than that, and a stale rate card produces stale conclusions. Bring sales, operations, and finance into the review together. Sales sees relationship context finance can’t see in the numbers, and ops knows where the real cost is hiding before it shows up in a report.
How TrueMeasure Accounting Runs This With Trades and Trucking Clients
Owner-operated service businesses tend to leak profit in the same handful of places. Legacy contracts signed years ago never get repriced. Manual exceptions, a rush order here, a waived delivery fee there, pile up invisibly. Long-tail customers get served at full cost because nobody ever separated them from the top accounts.
Our engagements typically move through the same phases:
- Clean up the bookkeeping and reconciliations so the underlying revenue and cost data can actually be trusted
- Build the driver rate cards specific to how the business operates, whether that’s truck rolls, delivery stops, or job-cost variances
- Model the pricing and service fixes against real historical volume before anyone talks to a customer
- Support execution: repricing conversations, service-tier restructuring, and tracking the CM II shift over the following quarters
This is the same operational lens Anthony Boncimino built running multi-million-dollar service businesses for two decades before founding the firm: the profit leak is rarely in the big obvious accounts. It’s in the manual exceptions nobody tracks.
Benchmarking Customer Profitability Against Industry Standards
There’s no universal “good” CM II percentage, because cost-to-serve structures vary wildly between a plumbing company running service trucks and a trucking company running long-haul lanes. What you can benchmark is concentration and distribution shape, not a single target number.
Compare your own whale curve shape against the general pattern researchers have documented: a steep early climb from your top accounts, a long flat middle, and a tail that often dips negative. If your top 20% of customers is generating closer to 400% or 500% of total profit rather than the 150% to 300% range typically observed, that’s a signal your long tail is doing more damage than average and needs faster attention.
Internally, benchmark quarter over quarter rather than chasing an external number that doesn’t reflect your cost structure. Track the percentage of revenue coming from customers in your “exit or restructure” quadrant. If that percentage is shrinking each quarter, your interventions are working. If it’s growing, your sales team may be adding volume without profitability screening at the intake stage, a common issue in fast-growing trades and transportation businesses.
Competitor benchmarking is harder to do with real numbers, since almost no company publishes customer-level margin data. Treat industry averages you find in trade association reports as directional only, and weight your own historical trend more heavily than any outside comparison.
Ethics and Relationship Management When You Act on the Data
Profitability data tells you what to change. It doesn’t tell you how to have the conversation, and that part matters more than the spreadsheet.
Don’t weaponize CPA to justify quietly reducing service quality for unprofitable customers without telling them. If a customer’s order pattern is driving up your cost-to-serve, the fair move is a direct conversation about restructuring the relationship: a minimum order size, a service fee, or adjusted terms, not a silent downgrade in response time or product substitution they never agreed to.
Be transparent about why pricing or service terms are changing when a customer asks. “Your order pattern has shifted, and here’s how we need to adjust to keep serving you well” holds up. A vague excuse doesn’t, and it damages trust with every other customer who eventually compares notes.
Watch for false positives, especially with newer customers or seasonal businesses whose ordering patterns look erratic in a short window but even out over a full year. Exiting a customer based on one noisy quarter can cost you a relationship that would have been profitable with a few more months of data.
Finally, keep the sales team in the loop before, not after, you act on findings that touch their accounts. A repriced customer who feels blindsided by a decision finance made in isolation is far more likely to leave angry than one whose sales rep walked them through the reasoning ahead of time.
Connecting CPA to Your CRM and ERP for Ongoing Tracking
A one-time customer profitability analysis is useful. An analysis that updates automatically every month is what actually changes behavior, because it catches drift before it becomes a quarter-long problem.
Most of the raw data already lives in your ERP or accounting system: invoices, discounts, freight charges, and payment terms. Your CRM or dispatch software holds the activity data: visit counts, support tickets, and special handling requests. The integration work is really about tagging transactions consistently by customer and, where possible, by customer-product combination, so the two data sources can be joined without manual reconciliation every time.
For most owner-operated businesses, this doesn’t require a new platform. It requires consistent customer IDs across systems and a recurring export process that feeds your rate-card model. Some ERP and CRM platforms now offer built-in profitability or margin reporting modules, which can automate the CM I calculation, though cost-to-serve allocation almost always still needs a layer built on top.
The payoff is catching a customer’s shift toward the unprofitable quadrant within a month instead of at year-end, when the damage has already compounded across dozens of transactions. Firms that build this into monthly financial reporting, rather than treating it as an annual project, catch far more leaks while they’re still small and fixable.
Software and Analytics That Make CPA More Accurate
Spreadsheets work for the first pass. They start breaking down once you’re tracking driver rates across more than a few dozen customers or trying to visualize a whale curve across hundreds of accounts.
Business intelligence platforms with data visualization capabilities make the customer profitability matrix and whale curve genuinely usable, since a scatter plot with color-coded quadrants communicates the finding to a sales team far faster than a table of CM II percentages ever will. The core technical requirement isn’t the visualization layer, though. It’s clean, transaction-level data feeding it, which is exactly why accounting and technology consulting work often starts with fixing the underlying data structure before anyone touches a dashboard.
For businesses with high transaction volume, time-driven activity-based costing scales more reliably than a flat rate card, since it captures actual time spent per activity rather than an average applied uniformly across every customer. That precision matters more once you’re managing thousands of transactions a month, where averages start hiding real variation between accounts.
Don’t let the tooling decision delay the first analysis, though. A clean spreadsheet with accurate driver rates beats a beautiful dashboard built on bad data every time.
Factoring in Customer Lifetime Value and Strategic Relationships
CM II tells you what happened. It says nothing about what a customer is worth over the next three years, and that gap can lead you to exit an account you should have kept.
A new customer with thin margins today might be in a ramp-up phase that normalizes within two quarters. A referral source who sends you three new accounts a year might carry negative CM II on their own account while generating enormous indirect value. Neither of those show up in a pure profitability snapshot, which is exactly why CPA works best paired with customer lifetime value estimates rather than treated as the sole decision input.
Build a simple override layer on top of your profitability matrix: flag strategic accounts (referral sources, brand-name customers who lend credibility, or accounts in a growth phase) before you run exit decisions. These customers might sit in the “reprice” quadrant rather than “exit,” even when the raw numbers suggest otherwise.
Loyalty tenure matters too. A customer profitable for eight straight years who has one rough quarter deserves a different conversation than a two-month-old account showing the same numbers. Weight your decisions by history, not just the trailing 12 months, and you’ll avoid cutting relationships that were never actually the problem.
Run the Top 20 Analysis Before You Do Anything Else
If you take one thing from this, run a top-20 customer profitability analysis this quarter. Not a perfect model, not a full ERP integration, just pocket revenue and a rough cost-to-serve estimate for your 20 biggest accounts. It typically takes a few weeks and almost always uncovers at least one account quietly draining margin you assumed was solid.
The payoff isn’t abstract. It’s freed cash, freed capacity, and a pricing conversation you should have had months ago.
— Tony
Let TrueMeasure Accounting Build Your Customer Profitability Model
TrueMeasure Accounting is the practical alternative to guessing which customers are actually worth keeping. Instead of a generic bookkeeping firm that hands you a P&L and calls it done, we build the driver rate cards, calculate CM I and CM II by customer, and help you act on what the numbers show, whether that’s a repricing conversation or a service-tier redesign.
This work starts with clean books. If your bookkeeping needs a catch-up before any profitability number can be trusted, that’s typically the first step. From there, our financial reporting and fractional CFO engagements turn the analysis into an ongoing part of how you run the business, not a one-time project that gathers dust. TrueMeasure Accounting offers tiered plans designed for businesses needing varying levels of analysis and advisory support. Current prices are on the pricing page. Visit our pricing page to see which tier fits a business your size, or reach out directly to scope a customer profitability engagement built around your top accounts.
Sources
- What is customer profitability analysis? – Teradata
- Customer profitability analysis – Wikipedia
- Manage customers for profits, not just sales – HBR
- Customer Profitability Analysis — Finding Where You Actually Make Money | Onetribe
FAQ
How do you calculate customer profitability?
Start with pocket revenue (invoiced revenue minus discounts, rebates, and freight), subtract direct costs to get CM I, then subtract allocated cost-to-serve using a driver rate card to arrive at CM II, the truest measure of what a customer contributes.
What are the four levels of profitability?
Most profitability frameworks move from gross margin, to contribution margin (CM I), to fully-loaded contribution margin after cost-to-serve (CM II), to net profit after overhead and fixed costs, with each layer stripping away a different category of expense.
What are the 5 profitability ratios commonly used?
The most common ratios are gross margin, operating margin, net profit margin, return on assets, and return on equity, though customer-level analysis typically relies on CM I and CM II rather than these company-wide ratios.
What does the customer profitability matrix show?
It plots revenue against cost-to-serve on two axes, sorting customers into quadrants for protecting your best accounts, repricing expensive-to-serve ones, maintaining low-effort accounts, and exiting or restructuring the ones losing money.
How many customers should I analyze first?
Start with your top 20 customers by revenue, which usually covers 60% to 80% of total revenue, then expand to the top 50 and aggregate the remaining long tail into segments.
Can TrueMeasure Accounting help build a customer profitability model?
Yes. TrueMeasure Accounting builds customer, job, and service-line profitability models as part of its financial reporting and fractional CFO services, starting with clean bookkeeping data and ending with pricing and service recommendations you can act on.