
A 13-week cash flow forecast is a rolling, weekly, direct-method projection of what actually clears your bank account, updated every single week without exception. Its job is simple: show you a liquidity crunch three months before it hits your account, not three days before. The rule that keeps it useful is non-negotiable. Every week’s starting balance must anchor to your actual reconciled bank balance, never a projected number carried forward from last week’s guesswork.
TL;DR:
- A 13-week cash flow forecast should continuously anchor weekly starting balances to actual reconciled bank figures to prevent cumulative errors.
- Building an accurate model requires specific inputs like current balances, aging reports, and a detailed payroll calendar, with weekly updates essential for reliability.
- Prioritize scheduling cash receipts and disbursements around fixed anchors, such as payroll, rent, and debt payments, to reflect true cash flow timing.
- Regular weekly review and variance analysis should aim for less than 5% total forecast deviation within the first month to ensure model accuracy.
- The forecast must be treated as a discipline, with automation and ownership key to maintaining its usefulness for proactive liquidity management.
Table of Contents
- What Is a 13-Week Cash Flow Forecast (And Why Weekly Beats Monthly)?
- How Do You Build a 13-Week Cash Flow Model?
- What Should a 13-Week Cash Flow Template Include?
- How Often Should You Update a Rolling Cash Flow Forecast?
- Common Mistakes That Make a 13-Week Forecast Useless
- How Service Businesses Should Build Their 13-Week Forecast
- When and How to Update Your Forecast Assumptions
- How to Connect Your 13-Week Forecast to Long-Term Planning
- How to Present Cash Flow Forecast Results to Leadership
- Treat This as a Discipline, Not a Spreadsheet Exercise
- How TrueMeasure Accounting Helps You Run This Every Week
- Sources
- FAQ
What Is a 13-Week Cash Flow Forecast (And Why Weekly Beats Monthly)?
A 13-week cash flow forecast tracks projected cash receipts and disbursements week by week across roughly one fiscal quarter, and you update it every week by dropping the week that just closed and adding a new week 13 to the end of the horizon. That rolling structure is why the Accordion CFO guide describes it as a living document rather than a static budget.
The 13-week window isn’t arbitrary. It covers a full quarter, which lines up with payroll cycles, quarterly tax deadlines, and most debt covenant reporting periods. Restructuring and turnaround practices standardized this exact horizon because it gives lenders and operators enough lead time to act on a problem while staying accurate enough in the near term to trust, according to Accordion’s practical guide.
Here’s the distinction that trips up most first-time builders: the direct method versus the indirect method. Your income statement uses the indirect method, starting from net income and adjusting for non-cash items. For a liquidity tool, you need the direct method, forecasting actual pools of cash receipts and disbursements as they’ll hit the bank, according to INGW’s breakdown of the model. Profit and cash are different animals, and a job can be profitable on paper while the business runs out of money waiting on receivables.
Three situations call for this tool immediately:
- Weekly treasury discipline for any business managing tight margins or seasonal swings
- Covenant reporting when a lender requires proof you can meet debt service obligations
- Seasonal cash management for trades and contractors where revenue and payroll timing rarely match
How Do You Build a 13-Week Cash Flow Model?
Building a working model isn’t complicated, but it does require pulling the right inputs in the right order. Rush this step and you’ll spend the next three months fighting a forecast that never matches reality.
-
Set up your cover sheet first. Record the week-ending date, the model owner (one person, not a committee), and your minimum cash policy, the dollar floor below which you trigger action. This isn’t busywork. It’s what keeps the model from becoming an orphaned spreadsheet nobody updates.
-
Pull your five core inputs. You need the current reconciled bank balance, AR aging by customer, AP aging by vendor, the payroll calendar for the full quarter, and your debt schedule including principal and interest dates. If you’re running capital projects, add the capex plan too.
-
Convert AR aging into weekly receipts. Don’t just spread outstanding invoices evenly across 13 weeks. Group customers into cohorts based on how they actually pay: net-30 commercial accounts that pay like clockwork, slow municipal or insurance-based payers, and cash-on-delivery residential work. Apply a collection curve to each cohort rather than assuming every dollar owed shows up on its due date.
-
Schedule disbursements around fixed anchors. Payroll is your biggest, most predictable outflow, so anchor everything else around it. Layer in AP runs (when you actually cut checks, not when bills are due), recurring fixed costs like rent and insurance, tax payments, and debt service dates from your loan schedule.
-
Run the rolling update every week. Replace week 1 with actual bank activity, shift everything else forward one column, and add a fresh week 13 with your best current assumptions. This is the mechanic that keeps the forecast alive, per Accordion’s guide.
-
Validate weeks 1 through 4 hard, then loosen up. Near-term weeks should reconcile almost exactly to actuals. Weeks 11 through 13 are directional. Top treasury teams report much higher accuracy in the first month than at the far end of the horizon, according to Transformance’s forecasting research, so don’t burn hours perfecting week 12 when week 2 is still off by 15%.
Pro Tip: Build your payroll calendar into the model before anything else. For most owner-operated service businesses, payroll timing drives more weekly cash volatility than any other single line, and getting crew pay dates exactly right in weeks 1 through 4 does more for accuracy than refining every other assumption combined.
What Should a 13-Week Cash Flow Template Include?
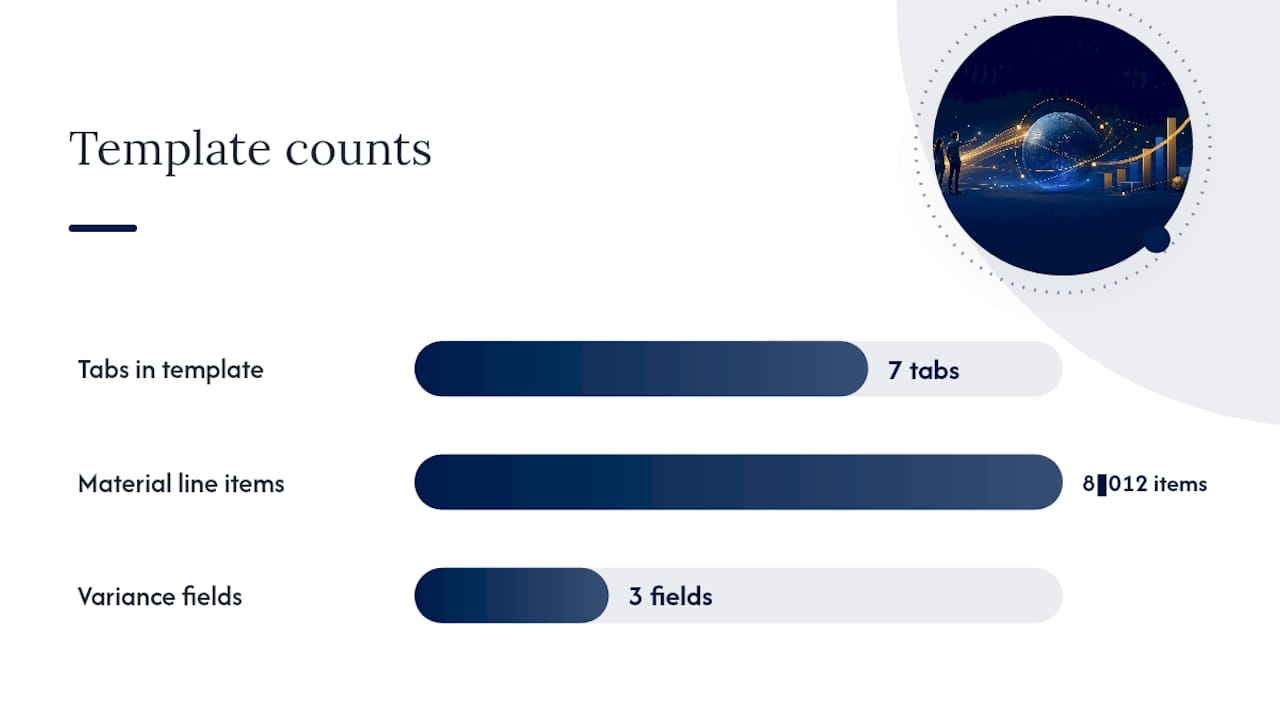
A working template needs seven tabs and almost nothing more. Add complexity here and you’ll spend Monday mornings fighting the spreadsheet instead of managing cash.
- Cover tab: version control, owner, minimum cash policy, last update date
- Inputs tab: raw pulls from AR aging, AP aging, payroll, and debt schedules before any manipulation
- Receipts tab: weekly cash collections broken out by customer cohort or revenue stream
- Disbursements tab: payroll, AP, rent, debt service, taxes, and capex by week
- Summary tab: beginning cash, net cash flow, ending cash, and your tightest week highlighted
- Variance tab: forecast versus actual by line, with a cause code for every meaningful gap
- Scenarios tab: a simple toggle for best case, base case, and stress case assumptions
Keep your receipts and disbursements tabs to 8 to 12 material line items. Most successful models stay this lean, separating out one-off items like an equipment sale or a legal settlement so they don’t distort the recurring pattern you’re trying to read, according to VeloraAI’s treasury playbook. More granularity feels more precise. It almost never is. A forecast with 40 line items takes twice as long to update and gets updated half as often.
Your summary tab is where the model earns its keep. It should surface beginning cash, net cash movement, ending cash, and, critically, a flag on your tightest week, the single week where the balance comes closest to your minimum cash policy. That’s the number that tells you whether you have eight weeks to fix a problem or two.
The variance tab needs three fields at minimum: dollar variance, percent variance, and a cause code (timing, amount, or bad assumption). Skip this tab and your forecast never gets smarter. It just repeats the same mistakes on a 13-week loop.
How Often Should You Update a Rolling Cash Flow Forecast?
Update it weekly, on the same day, with the same short meeting, every time. Most finance teams anchor this to Monday morning, before the week’s real activity starts.
-
Reconcile the bank first. Pull the actual closing balance for the week that just ended before you touch anything else in the model. This is the anchor point everything else depends on.
-
Compare forecast to actual, line by line. Run the variance loop: what did you predict, what actually happened, and what’s the dollar and percent gap? Float’s implementation guide recommends scoring every meaningful variance with a cause code so patterns become visible over time.
-
Sort variances into three buckets. A timing variance means the cash was right but landed in a different week (a customer paid Thursday instead of Monday). An amount variance means you got the dollar figure wrong. An assumption variance means your underlying logic, like a collection curve, needs revision.
-
Score your accuracy and watch the trend. A mature weekly process should land total variance inside roughly 5% by week four or five of running the discipline. Persistent variance beyond that usually points to weak AR or AP assumptions, not bad luck, according to Accordion’s guidance.
-
Make a decision, not just an observation. The whole point of a 20 to 30 minute Monday cash conversation is action: delay a discretionary payment, push a collection call on a slow account, or draw on a line of credit before the tightest week arrives instead of after.
Common Mistakes That Make a 13-Week Forecast Useless
Most forecasts fail for the same handful of predictable reasons, and every one of them is fixable in an afternoon.
- Carrying forward a projected balance instead of the reconciled one. This is the single fastest way to compound errors. Anchor every week to the actual bank balance, as INGW’s explainer stresses, or small misses snowball into a model nobody trusts by week six.
- Building 30 line items when 10 would do. Excessive granularity buries the signal. Flag one-off items separately instead of forcing them into a recurring category.
- No clear owner. If three people can edit the model and nobody’s accountable for the weekly update, it goes stale within a month.
- Stale AR and AP inputs. Pulling aging reports every other week instead of every week guarantees your receipts forecast drifts from reality.
Pro Tip: Automate the extract if you can. Pulling AR aging, AP aging, and the bank balance manually every Monday is exactly the kind of friction that kills weekly discipline after the third or fourth cycle. Automated tools remove that manual assembly so your Monday meeting is spent on decisions, not data entry.
How Service Businesses Should Build Their 13-Week Forecast
Working with HVAC companies, plumbing outfits, contractors, and trucking operations for years has taught us that generic templates miss the lines that actually move cash in this world. Priority items look different here than in a typical SaaS or retail model:
- Payroll by crew, not a single lump sum. Different crews often run different pay cycles or overtime patterns tied to job schedules.
- Subcontractor payments on their own line, since these often carry different timing rules than your standard AP run.
- Parts, materials, and fuel as a distinct category, because these swing hard with job volume and diesel prices.
- Progress billings tracked separately from standard invoicing, since draw schedules on construction work rarely match a clean net-30 curve.
We enforce three weekly non-negotiables with our clients: reconcile the bank before touching the model, map the payroll calendar a full quarter out, and run active collection plays on slow-paying accounts rather than waiting passively. When a business owner is spending more than a few hours a month wrestling with this model, that’s usually the signal it’s time for fractional CFO support instead of another spreadsheet.
When and How to Update Your Forecast Assumptions
Assumptions go stale faster than most owners expect, and a forecast running on outdated logic is worse than no forecast at all because it creates false confidence.
Revisit your collection curves any time you land a new customer type, change payment terms, or notice a shift in how fast a major account pays. A commercial client that historically paid in 30 days but has slipped to 45 needs a curve adjustment immediately, not at quarter end. The same applies to vendor terms. If a key supplier tightens payment windows or you renegotiate better terms, update the AP disbursement timing the same week you learn about it.
Seasonal businesses need a harder look every quarter. If your trucking or HVAC volume swings meaningfully between summer and winter, your base assumptions for receipts and payroll hours should shift with the season, not stay static all year. Interest rate changes on variable debt, a new equipment loan, or a change in your payroll headcount all warrant an immediate assumption update rather than waiting for the next scheduled review.
The test for whether an assumption needs updating is simple: did reality diverge from the forecast for a reason that will repeat? A one-time late payment from a normally reliable customer is noise. A structural shift, a new competitor pressuring your pricing, a supplier raising terms, a new hire changing your payroll cadence, is signal, and signal belongs in the model immediately. Treat your variance log as the early warning system that tells you which is which.
How to Connect Your 13-Week Forecast to Long-Term Planning
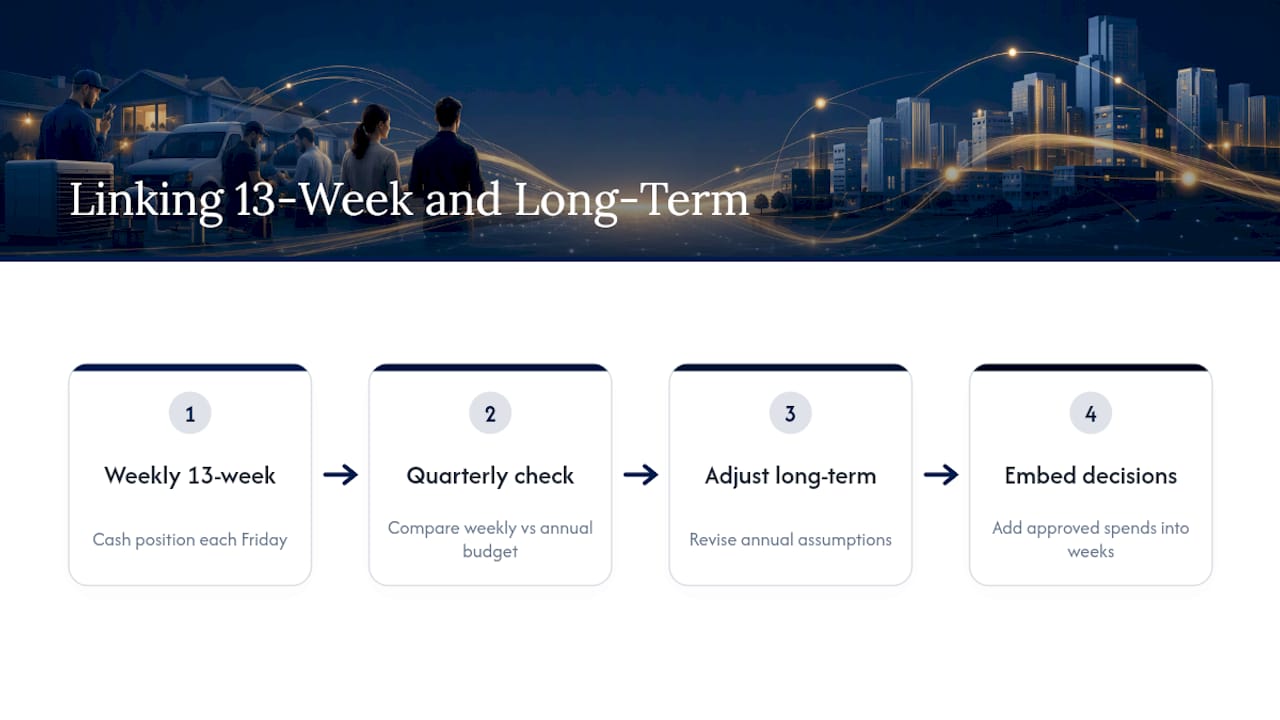
The 13-week forecast and your annual budget answer different questions, but they should never contradict each other. The weekly model tells you if you’ll have enough cash in the bank on a specific Friday. Your annual plan and three-to-five-year projections tell you whether the business model itself works.
Use the 13-week forecast as a reality check against your annual budget every quarter. If your weekly actuals consistently run below the monthly cash targets baked into your annual plan, that’s an early signal your annual assumptions are too optimistic, not just a short-term timing issue. Feed that back into your longer-range planning before it compounds into a full-year miss.
The reverse connection matters too. Major decisions from your long-term plan, a planned equipment purchase, a new hire, an expansion into a new service line, need to land inside the 13-week model the moment they’re approved, not when the invoice arrives. This is where a lot of growing service businesses get caught: they approve a capital purchase in a strategy meeting and forget to schedule it into weekly cash until the deposit is due.
Beyond crisis management, treating the rolling forecast as a standing operating discipline supports proactive tax payment timing, securing short-term financing before you need it under pressure, and managing seasonal cash risk well ahead of the tight month, according to Intuit’s overview of the model. If your business runs profitable but still feels perpetually cash-poor, the disconnect is usually timing mismatches between the P&L and actual cash that only a weekly model surfaces clearly.
How to Present Cash Flow Forecast Results to Leadership
Nobody outside finance wants to see 13 columns of numbers. They want three things: where we stand today, where we’re headed, and what decision you need from them.
Lead every update with the tightest week, the single week in your horizon closest to your minimum cash threshold, and how many weeks out it sits. That one data point tells an owner or a lender more than the entire spreadsheet. Follow it with your current accuracy trend, since a lender or bank relationship manager cares far more about whether your forecasts have proven reliable than about the raw numbers themselves. Consistent accuracy is what makes the forecast credible enough that a lender treats your projections as trustworthy in a workout or covenant conversation, according to INGW’s analysis.
Skip the full variance tab in leadership meetings.
When you need a decision, put it in front of them in dollar terms and a specific week, not general terms. “We should draw $40,000 on the line of credit in week 6” gets action. “Cash is getting tight later this quarter” gets a shrug and a follow-up email nobody answers.
Treat This as a Discipline, Not a Spreadsheet Exercise
The forecasting model itself matters far less than most people assume. A basic Excel workbook run consistently every Monday beats a sophisticated connected-software setup that gets updated once a month when someone remembers. The discipline is the product, not the formulas.
Leaders who get real value from this tool use it inside their weekly decision cycle, not as a quarterly report they glance at and file away. It becomes the thing that answers “can we make payroll in week 6” before payroll in week 6 becomes a problem.
Run four straight weekly cycles before you touch the structure. Most owners want to fix the template after week one because it feels imperfect. Give it a month. The model gets more accurate as your assumptions calibrate against real weekly variance, not as you add more rows.
— Tony
How TrueMeasure Accounting Helps You Run This Every Week
Building the model is the easy part. Running it every single Monday for a full year, while also running a business, is where most owners quietly let it slide. TrueMeasure Accounting exists for exactly that gap: we build the template around your actual operations, then keep it accurate through the monthly bookkeeping and reconciliation work that anchors every week to a real bank balance instead of a guess.
For most owner-operated service businesses, the right starting point is a template setup engagement paired with our managed bookkeeping workflow, so your AR aging, AP aging, and payroll calendar feed the model automatically instead of by hand. As the business grows past what a template can handle alone, that same client typically steps into a fractional CFO retainer for the weekly cash conversation itself, not just the spreadsheet. Plans start with Essentials at a competitive monthly rate, scale to Plus for more hands-on support, and Premium is available for businesses that need full fractional CFO coverage built around this discipline. Reach out to talk through which starting point fits your current cash position.
Sources
For deeper background, the Accordion CFO guide and Float’s implementation walkthrough cover the model in more technical depth. If you’re comparing broader accounting software categories for your books, general small business accounting tool overviews offer a useful category-level starting point. For a simpler build, our own small business cash flow forecast guide walks through a lighter version.
- 13-Week Cash Flow Forecasting: A CFO’s Practical Guide
- The 13-Week Cash Flow Forecast, Explained
- Free 13-Week Cash Flow Forecast Template + Calculator | Transformance
- How Do You Implement A 13-Week Cash Flow Forecast?
- What is the 13-week cash flow forecast?
FAQ
What Is a 13-Week Cash Flow Chart?
A 13-week cash flow chart is the visual summary tab of the forecast, typically showing beginning cash, weekly net cash movement, and ending cash across the full quarter as a line or bar chart. It’s built from the same weekly receipts and disbursements data as the full model, just condensed for quick reading by leadership or a lender.
What Does “Rolling 13 Weeks” Mean?
Rolling means the horizon never shrinks. Each week you drop the week that just closed, replace its numbers with actuals, and add a fresh week 13 to the far end, so you always have a full quarter of forward visibility, according to Accordion’s guide.
What Is the 13-Week Cash Budget?
The 13-week cash budget is another name for the same tool: a direct-method, weekly forecast of cash receipts and disbursements over roughly one fiscal quarter. Some teams use “budget” and “forecast” interchangeably here, though a true budget implies a fixed target while the rolling forecast updates every week against actuals.
What Is a 12-Month Rolling Cash Flow, and How Is It Different?
A 12-month rolling cash flow tracks cash by month over a full year and serves longer-range planning, while the 13-week model tracks by week over one quarter for near-term liquidity decisions. The two should stay reconciled to each other, but they answer different questions: the 12-month view tells you if the business model works, and the 13-week view tells you if you’ll make payroll six weeks from now.
Does TrueMeasure Accounting Build 13-Week Forecasts for Clients?
Yes. TrueMeasure Accounting builds and maintains 13-week cash flow templates as part of its bookkeeping and fractional CFO services, tailored around payroll calendars, AR collection curves, and job costing data specific to service businesses. Current pricing for these engagements is listed on the pricing page.