

Labor burden rate is the percentage of employer-paid costs stacked on top of base wages, including payroll taxes, workers’ comp, benefits, and PTO. The formula is simple: total burden cost divided by direct wages, times 100. Once you know that number, you apply it to every wage to get a fully burdened hourly rate, and that rate, not the paycheck number, is what belongs in your job pricing.
TL;DR:
- Most businesses underestimate labor burden costs because they overlook categories such as payroll taxes, workers’ comp, benefits, PTO, and travel expenses.
- Proper calculation requires matching burden items and wages over the same period, ideally a full year, and using actual carrier invoices for premiums rather than estimates.
- Industry benchmarks vary: lean operations have lower burden rates, while high-risk trades and union shops often face higher costs due to benefits and workers’ comp.
- Confusing labor burden with overhead leads to underpricing jobs, since burden covers only employee-related costs, while overhead includes broader business expenses.
- Regular reconciliation of actual wages, taxes, and insurance invoices ensures accurate burden rates, improving job costing, pricing, and cash flow management.
Table of Contents
- What Costs Actually Belong in Your Labor Burden Rate
- How to Calculate Labor Burden Rate Step by Step
- Worked Examples: From Wages to Fully Burdened Rate
- What’s a Normal Labor Burden Rate for Your Industry?
- Labor Burden vs. Overhead: Don’t Confuse the Two
- Where Burden Calculations Go Wrong
- Calculators, Spreadsheets, and What to Pull From Your Payroll System
- How TrueMeasure Turns Burden Rates Into Pricing Decisions
- An Operator’s Take on Why This Number Gets Ignored
- Get Help Turning Burden Rates Into Profitable Bids
- Sources
What Costs Actually Belong in Your Labor Burden Rate
Most business owners underestimate this number because they only think about the paycheck. The real cost of putting someone on a job site includes several categories, and missing even one of them quietly erodes your margin on every bid.
- Employer payroll taxes: You owe employer FICA at 7.65% of wages, plus FUTA and state SUTA, which varies by state and by your claims history. Pull your actual rates from your payroll reports or your state’s labor department site. The SBA notes that employers routinely underestimate these mandatory add-ons when pricing labor.
- Workers’ compensation: Premiums swing widely by class code. A framing crew and an office administrator on the same payroll can carry wildly different comp rates, so calculate this per role, not as a company average.
- Benefits and retirement contributions: Convert your employer-paid health premium and any 401(k) match into a per-employee monthly amount, then annualize it.
- PTO, training, onboarding, equipment, and uniforms: These are real costs tied to specific employees. Allocate them to the period you’re measuring, whether that’s a month or a full year.
- Travel and vehicle costs: If you pay for windshield time or provide a company vehicle, that belongs in the burden calculation for field roles.
The rule that matters most here isn’t which categories you pick. It’s that you pick them once and apply them the same way every quarter, so your rate this year is actually comparable to your rate last year.
How to Calculate Labor Burden Rate Step by Step
The core formula, straight from Investopedia’s definition of burden rate, is this:
Burden Rate (%) = Total Burden Cost ÷ Direct Wages × 100
Calculating labor burden correctly comes down to sequencing. Skip a step and your number will look fine on paper while being wrong in practice.
- Pick your period. A full calendar year gives the cleanest picture because it smooths out seasonal PTO usage and bonus timing. A month works for a quick check, but expect more noise.
- List every burden item for that period. Payroll taxes, workers’ comp premiums, health and retirement contributions, PTO paid out, training, equipment, and any allocated overhead you’ve decided belongs here.
- Sum the burden total. This is your numerator.
- Pull direct wages for the same employees, same period. Match the denominator to the same headcount and time frame as your burden costs. Comparing a quarter of burden costs against a year of wages will hand you a meaningless rate.
- Divide and multiply by 100. That’s your burden rate as a percentage.
- Convert to hourly if needed. Use 2,080 hours as the standard annual base for a full-time employee, then adjust for anyone who works part-time or racks up significant overtime, since overtime pay changes the wage denominator without proportionally changing most burden items.
Before you lock in the number, run a quick checklist: same period on both sides of the equation, no double-counted PTO, and workers’ comp calculated on the correct payroll base rather than an estimate from last renewal.
Worked Examples: From Wages to Fully Burdened Rate
Numbers make this real faster than definitions do. Here’s how the math plays out for three common scenarios in a service business.
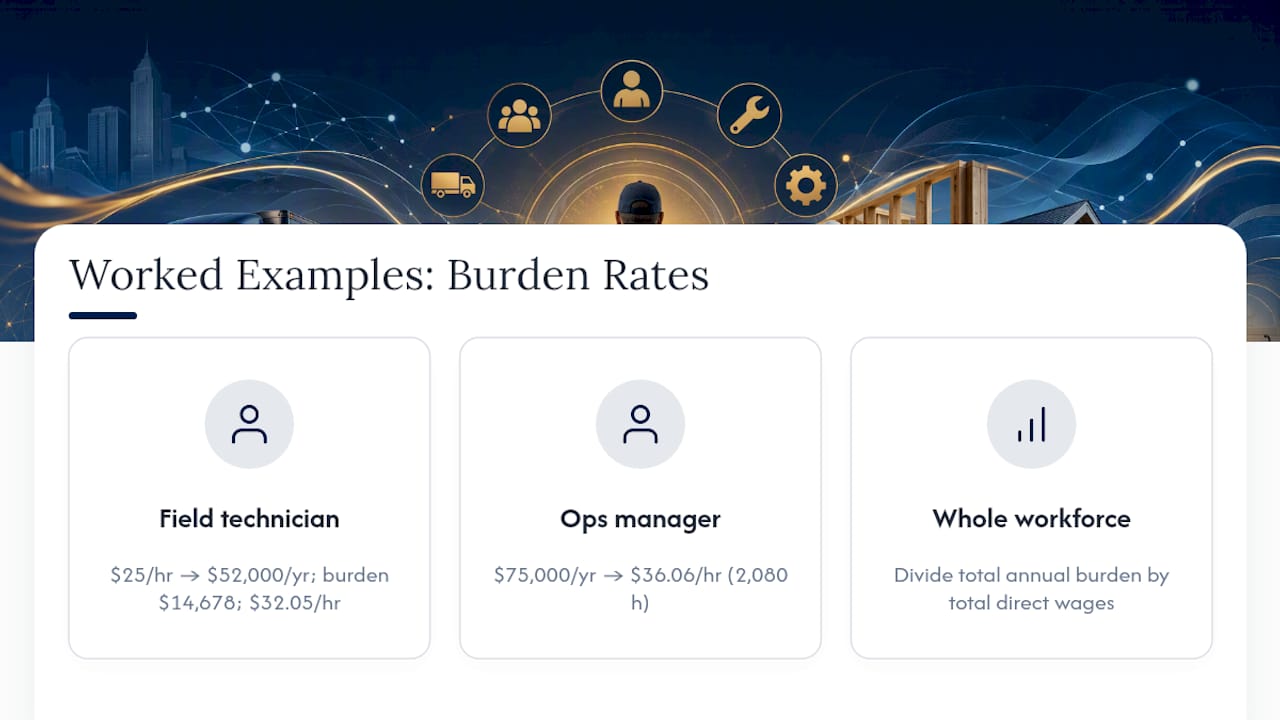
Example 1: Hourly field technician. Say a technician earns $25/hour and works 2,080 hours a year, for $52,000 in base wages. Total burden: $14,678. Fully burdened hourly rate: roughly $32.05.
Example 2: Salaried operations manager. A manager earning $75,000 annually converts to $36.06/hour at 2,080 hours.
Example 3: Whole-workforce aggregate. For a company-wide check, divide total annual burden across all employees by total annual direct wages. A trucking company with substantial wages and a significant aggregate burden can have an overall rate that informs its position before breaking out individual roles.
A simple spreadsheet layout keeps this repeatable:
Pull the wage and PTO lines straight from your payroll export, and pull workers’ comp and health numbers from the actual carrier invoices rather than budgeted estimates — using boekhoudsoftware die zorgt voor automatische loonheffingen can help streamline this process.
What’s a Normal Labor Burden Rate for Your Industry?
Most operations land somewhere in a moderate range, with lean operations at the lower end and high-risk trades at the higher end.
Here’s roughly how that breaks down by profile:
- Lean, benefits-light operations typically have lower burden rates, as seen in smaller shops with minimal health coverage and low-risk work.
- Established trades such as HVAC, plumbing, and electrical contractors generally fall in a moderate range with standard benefits packages.
- High-risk trades and union shops tend to incur higher burden rates due to elevated workers’ comp costs, richer benefits, and union-negotiated contributions.
The BLS Employer Costs for Employee Compensation data breaks these figures out by region and industry, which is a far more useful benchmark than a flat national average. What actually drives the spread within a single trade is your workers’ comp class code, how generous your benefits are, whether you’re operating under a union agreement, and how much your state’s SUTA rate differs from a neighboring state. Turnover matters too. A crew that churns through new hires every few months carries hidden training and onboarding costs that never show up as a clean line item but still belong in the numerator.
If your rate sits well outside the range for your specific trade and risk profile, treat that as a signal to dig into your workers’ comp classification or your benefits structure, not as proof something is broken.
Labor Burden vs. Overhead: Don’t Confuse the Two
Burden rate covers only labor-related indirect costs: taxes, comp, benefits, PTO. Overhead rate is broader. It captures every indirect business expense, including rent, insurance, office staff, software, and vehicle depreciation that isn’t tied to a specific employee’s paycheck.
That distinction changes how you price a job.
- For job quotes: Use fully burdened labor cost, then layer on an overhead allocation to cover the non-labor indirect costs of running the business.
- For financial reporting: Track burden and overhead as separate line items so you can see which one is actually squeezing your margin.
- Rule of thumb: If a number relates directly to a specific employee’s paycheck, it’s burden. If it exists regardless of who’s on payroll, it’s overhead.
Confusing the two is one of the fastest ways to underprice a job, because a rate that only covers labor burden leaves your rent, insurance, and software subscriptions with nowhere to come from.
Where Burden Calculations Go Wrong
The math itself isn’t hard. Where businesses get burned is in the inputs and the discipline around them.
- Mixing periods. Using a full year of burden costs against a single quarter of wages, or vice versa, produces a rate that looks precise and means nothing.
- Using total labor cost as the denominator. The denominator should be direct wages only, not wages plus burden, or you’ll understate your true rate.
- Ignoring PTO. Paid time off is real cost even though no work happens during it, and skipping it is one of the most common ways businesses underprice labor.
- Changing inclusion mid-period. If you add a new benefit category in June, your July rate isn’t comparable to your January rate unless you note the change.
Pro Tip: Reconcile your workers’ comp and health insurance numbers against the actual carrier invoices every quarter, not just against your payroll software’s estimate. Payroll systems often use outdated premium rates that drift from what you’re actually being billed.
The fix for most of this is procedural, not mathematical. Fix your inclusion policy in writing, reconcile insurance invoices against payroll records monthly, and record payroll tax liabilities as they accrue rather than catching up at quarter-end. Assign one person, whether that’s your bookkeeper or controller, to own the monthly burden reconciliation so the number stays trustworthy enough to price jobs against.
Calculators, Spreadsheets, and What to Pull From Your Payroll System
A free online calculator, like the ones offered by TrueStep HR or Connecteam, is fine for a one-time gut check on a single role. It’s not built for tracking burden across a full workforce over time, and it won’t reconcile against your actual invoices.
- Use a calculator for a quick estimate when you’re pricing a single new hire or sanity-checking a bid on the fly.
- Build a spreadsheet template once you’re tracking burden across multiple roles or reporting it monthly, so you can trend it over time.
- Map your payroll export fields: gross wages, employer payroll tax lines, benefits expense accounts, and workers’ comp premiums all need their own column.
- Set a cadence. Update monthly if you’re pricing jobs weekly; quarterly is enough if you’re mainly using it for annual budgeting.
- Reconcile against carrier invoices, not payroll summary estimates, for health insurance and workers’ comp specifically, since those two categories drift the most from budgeted figures. Cleanup work in QuickBooks often surfaces exactly this kind of drift.
How TrueMeasure Turns Burden Rates Into Pricing Decisions
We treat inclusion policy as a fixed rule, not a moving target. Every client report defines the same burden categories the same way, month after month, so a rate from March means the same thing in November. That consistency is what makes the number usable for profitability tracking by employee or job instead of just a compliance line item.
We’ve seen this play out with contractors who priced bids off base wage alone for years, then switched to fully burdened labor cost and found bids that looked profitable on paper were actually breaking even once workers’ comp and benefits were counted honestly.
Pricing off base wage instead of fully burdened cost is one of the most common reasons a contractor’s revenue grows every year while cash in the bank doesn’t move. The job costing was never wrong on labor hours. It was wrong on labor cost.
In fractional CFO engagements, burdened rates become the threshold for hire-versus-subcontract decisions and the baseline for labor-efficiency KPIs tied to actual job margin, not just billable hours.
An Operator’s Take on Why This Number Gets Ignored
Most owner-operators know their workers’ comp premium and their health insurance bill. What they don’t do is connect those numbers back to the hourly rate they’re quoting on a job, and that gap is where margin quietly disappears. I’ve seen plenty of businesses that were profitable on the income statement and still tight on cash every month, and the labor burden rate is often the first place I look, because it’s the one number that touches pricing, job costing, and cash flow all at once.
The practical move is small: run the calculation once this week, using real payroll and carrier invoice numbers instead of estimates. Then price your next bid using the fully burdened rate instead of base wage and see how the margin changes. If the number surprises you, reconciling your books is the logical next step before you quote another job off the wrong figure.
— Tony
Get Help Turning Burden Rates Into Profitable Bids
Professional bookkeeping and job-costing services provide an alternative to guessing at labor cost when you’re pricing jobs. Instead of pulling a rough percentage from memory, you get bookkeeping and job-costing work that keeps your burden inputs, payroll tax lines, benefits accounts, and workers’ comp premiums clean and current every month.

Our bookkeeping services build the accurate labor cost data that fully burdened pricing depends on, and our fractional CFO work uses that same data to set hiring thresholds, pricing floors, and cash flow forecasts you can actually trust. If you run an HVAC, plumbing, electrical, construction, or trucking business and you’re not sure your current bids cover your true labor cost, see how our process works and reach out to get your burden rate calculated correctly.
Sources
- Employer costs for employee compensation — BLS
- How much does an employee cost you? — SBA
- What Is the Burden Rate? Definition, Costs, and Examples — Investopedia
Check your own payroll reports and carrier invoices before finalizing any rate. Published benchmarks are a reference point, not a substitute for your actual numbers.