

Contractor profitability analysis is the method contractors use to calculate, track, and improve their true profit margins by accounting for every direct and indirect cost tied to a construction project. Most contractors know their revenue. Far fewer know their actual profit after burdened labor, allocated overhead, and subcontractor costs are properly applied. The construction industry averages net profit margins of 3–7% for general contractors and 5–9% for specialty trades, with top performers reaching 10–15%. That narrow range means one mismanaged job can erase the gains from three profitable ones. Getting this right is not optional for a sustainable construction business.
What are the key cost components in contractor profitability?
True project profitability starts with knowing every cost that belongs to a job. Contractors who undercount costs consistently overbid on margin and underearn on execution.
The four primary direct cost categories are:
- Materials: All raw materials, supplies, and consumables purchased for the project. Track these against the estimate line by line, not as a lump sum.
- Burdened labor: Base wages multiplied by a burden factor that accounts for payroll taxes, workers’ compensation, benefits, paid leave, and nonproductive hours. Burdened labor multipliers range from 1.35x to 1.65x base wage. A field worker earning $25 per hour actually costs $34–$41 per hour when the burden is applied. Omitting this step inflates profit estimates and blinds you to true margins.
- Subcontractors: All payments to subs, including any markup you apply to cover coordination risk.
- Equipment: Owned equipment should carry an internal rental rate. Rented equipment costs should be tracked per job, not pooled into overhead.
Beyond direct costs, overhead allocation is where many contractors lose visibility. The best practice is to calculate your overhead rate as a percentage of prior year revenue, then apply that rate to each job’s revenue. Overhead rates run roughly 8–12% for general contractors and 10–15% for specialty trades. Best-in-class firms hold overhead to 6–8%. That gap between average and best-in-class directly determines whether your net margin lands at 4% or 12%.
Sales commissions and estimating costs are two line items that routinely get missed. If a salesperson earns 3% of a job’s contract value, that cost belongs in the job’s cost structure, not buried in a general sales expense account.
Pro Tip: Build your burden multiplier once per year using actual payroll data, then apply it consistently to every estimate and job cost report. Recalculating it job by job creates inconsistency and errors.
Labor costs make up 30–50% of project costs and are volatile due to trade shortages and rising compensation. That volatility makes burdened labor the single highest-risk line item in any estimate.
How to measure gross profit margin and net profit margin in construction
Gross profit margin measures the percentage of revenue remaining after all direct project costs are subtracted. The formula is straightforward: gross profit divided by revenue, expressed as a percentage.

Gross Profit Margin = (Revenue − Direct Costs) ÷ Revenue × 100
The typical gross profit margin for general contractors runs 12–16%, while specialty contractors average 15–25%. The industry average sits around 14.8%. These ranges reflect the difference in complexity, risk, and labor intensity between trade types.
Net profit margin goes one step further by subtracting overhead and all other indirect costs from gross profit.
Net Profit Margin = (Revenue − Direct Costs − Overhead − Other Indirect Costs) ÷ Revenue × 100
| Contractor Type | Gross Profit Margin | Net Profit Margin | Overhead Rate |
|---|---|---|---|
| General contractors | 12–16% | 3–7% | 8–12% |
| Specialty trades | 15–25% | 5–9% | 10–15% |
| Top quartile performers | 20–28% | 10–15% | 6–8% |
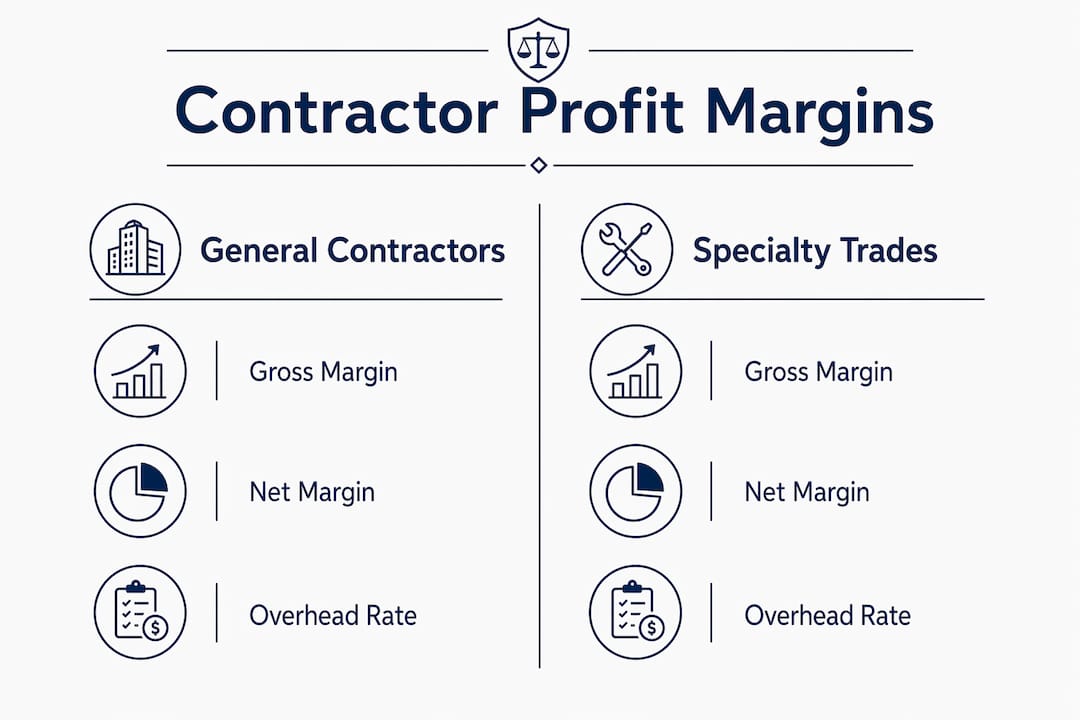
The gap between gross and net margin is your overhead efficiency score. A general contractor with a 15% gross margin and a 10% overhead rate nets only 5%. That same contractor with an 8% overhead rate nets 7%. Overhead discipline is one of the fastest levers available for improving net margins without winning more work.
Gain/fade analysis adds a time dimension to these metrics. Gain means your projected final margin is tracking above the bid-day estimate. Fade means it is eroding. Gain/fade analysis of each project reveals operational efficiencies and client or project manager patterns, allowing targeted margin protection strategies. Tracking fade by project type and project manager shows you exactly where your business leaks money.
Pro Tip: Review projected final margin on every active job at least monthly. A job that fades 3 percentage points in month two rarely recovers by closeout.
What causes margin fade and how do you manage it?
Margin fade is the difference between the margin you estimated on bid day and the margin your project is actually tracking toward at completion. It is the primary early warning sign of operational inefficiency. Fade tracking by project type and manager reveals performance patterns that aggregate financial reports will never surface.
The most common causes of margin fade are:
- Cost overruns on labor. Field crews work more hours than estimated, often because the original estimate used straight wages instead of burdened rates or underestimated task complexity.
- Unpriced scope creep. Work gets done in the field before a change order is approved or even submitted. The cost hits the job; the revenue never follows.
- Inaccurate original estimates. Estimates built on gut feel rather than historical job cost data consistently miss on labor productivity and material waste.
- Delayed change order processing. Even legitimate change orders lose margin when they sit unsigned for weeks. Carrying the cost while waiting for approval erodes cash flow and margin simultaneously.
- Poor closeout management. Punch list items drag on, retainage sits uncollected, and the job stays open on your books while overhead continues to accumulate.
Aggressive closeout management, including punch list completion and retainage release, can improve margins by 1–2 percentage points per job. Across a portfolio of 20 jobs per year, that is a material improvement to annual net profit.
Cost-to-complete analysis is the operational tool that keeps fade visible in real time. At any point in a project, you calculate how much it will cost to finish the remaining scope, then compare that to the remaining budget. If cost-to-complete exceeds remaining budget, you have a problem you can still act on. Earned value management takes this further by comparing the budgeted value of work completed against actual costs incurred, giving you a precise efficiency ratio.
Accurate, historical data-driven estimating and real-time cost tracking throughout project execution protect bid-day margins and improve profitability outcomes. Contractors who build estimate databases from closed job data consistently outperform those who estimate from memory or industry averages.
Pro Tip: Assign a projected final margin number to every active job at your weekly operations meeting. Make it a standing agenda item. The discipline of saying the number out loud forces accountability.
How do benchmarks and financial ratios help contractors improve margins?
Benchmarks give your financial metrics context. A 5% net margin feels acceptable until you learn that specialty trade contractors in your region average 7%. That gap is worth investigating.
The current ratio for construction companies generally sits around 1.9, with sureties accepting 1.5 or above. Ratios above 2.0 indicate excellent financial health and bonding capacity. This metric matters beyond internal management because sureties and lenders use it to evaluate your ability to take on larger projects.
Days Sales Outstanding (DSO) measures how long it takes to collect payment after invoicing. A high DSO signals billing delays, slow approvals, or retainage buildup. For contractors, a DSO above 45 days typically indicates a cash flow problem waiting to surface.
Return on Assets (ROA) tells you how efficiently your equipment and capital generate profit. A contractor with $2 million in assets generating $100,000 in net profit has a 5% ROA. Improving that ratio means either earning more profit from existing assets or reducing the asset base through equipment rental instead of ownership.
| Metric | General Contractors | Specialty Trades | Best-in-Class |
|---|---|---|---|
| Net profit margin | 3–7% | 5–9% | 10–15% |
| Overhead rate | 8–12% | 10–15% | 6–8% |
| Current ratio | ~1.9 | ~1.9 | 2.0+ |
| DSO (days) | 45–60 | 40–55 | Under 40 |
Margin compression is structural in construction due to competitive bidding and volatile costs. Best performers differentiate through operational discipline and selective bidding, not by winning more jobs at thin margins. Benchmarking helps you identify which metrics to address first and gives you a credible target to aim for.
What practical steps help contractors track and improve profitability?
Construction profit analysis works best when it is built into your weekly and monthly routines, not treated as a year-end exercise.
The manual foundation is job-by-job profit calculation. For every completed or active project, calculate:
- Contract revenue (including approved change orders)
- Minus direct costs (materials, burdened labor, subs, equipment)
- Minus allocated overhead (overhead rate × job revenue)
- Equals net job profit
Divide net job profit by contract revenue to get your net job margin. Do this for every job, every month.
Digital tools and accounting software with job costing modules make this process faster and more accurate. Platforms that integrate field time tracking with your accounting system eliminate the manual labor of transferring hours. Tracking profit per job with real-time data means you catch problems in week three, not after closeout.
Technology adoption including BIM, prefabrication, and project management tools improves cost predictability and reduces waste, helping protect contractor margins. Firms using these tools report fewer cost overruns and better schedule adherence. The upfront investment in technology pays back through margin protection on every project that follows.
Beyond tools, the operational strategies that consistently improve contractor margins are:
- Selective bidding: Pursue jobs where your historical data shows strong margins. Walk away from project types where you consistently fade.
- Workforce retention: High turnover in field crews destroys productivity and drives up burdened labor costs. Retention is a margin strategy, not just an HR concern.
- Value engineering: Propose material or method substitutions that reduce cost without reducing scope. Document the savings and protect them in the estimate.
- Billing discipline: Invoice promptly, follow up on approvals, and submit change orders the same week the scope change occurs.
Contractor bookkeeping services built around job costing give you the financial visibility to execute all of these strategies consistently. Without accurate books, the analysis has no foundation.
Key Takeaways
Contractor profitability analysis requires tracking burdened labor, overhead allocation, and projected final margin on every active job to protect and improve net margins.
| Point | Details |
|---|---|
| Use burdened labor rates | Apply a 1.35x–1.65x multiplier to base wages to capture true labor cost in every estimate. |
| Allocate overhead by job | Apply your overhead rate as a percentage of revenue to each project for accurate net margin. |
| Track projected final margin | Review margin fade monthly on every active job to catch cost overruns before closeout. |
| Benchmark against industry data | General contractors target 3–7% net margin; specialty trades target 5–9%; top performers reach 10–15%. |
| Price and close change orders fast | Unpriced scope and delayed retainage collection are the two fastest ways to lose margin after bid day. |
What I’ve learned about profitability from the field
Most contractors I work with are not losing money because they are bad at their trade. They are losing margin because their financial data is 60 days behind their operations. By the time they see a job’s true cost, the decisions that caused the problem are already made and locked in.
The contractors who consistently hit the top quartile of net margins share one habit: they treat projected final margin as a live number, not a year-end calculation. They look at it weekly. They assign ownership of it to a project manager. They make it uncomfortable to let a job fade without a documented reason and a recovery plan.
The other pattern I see is that most contractors underestimate overhead. They track field costs carefully but let office costs, insurance, estimating time, and vehicle expenses pile up in a general overhead bucket that never gets allocated back to jobs. When you do not allocate overhead properly, your job-level margins look better than they are. Your company-level margin tells the real story, and the gap between the two is where the confusion lives.
The fix is not complicated. It requires accurate books, a consistent overhead rate, burdened labor in every estimate, and a weekly habit of reviewing job-level performance. Truemeasureaccounting works with contractors every day who have the operational skills to build great projects. The ones who grow sustainably are the ones who add financial discipline to those skills.
— Tony
How Truemeasureaccounting supports contractor financial performance
Accurate books are the foundation of every profitability improvement a contractor can make. Without clean, current financial data, job costing is guesswork and benchmarking is impossible.
Truemeasureaccounting provides bookkeeping services built specifically for contractors and construction businesses, including monthly reconciliations, job cost reporting, overhead allocation, and KPI tracking. The firm’s founder, Anthony Boncimino, spent more than 20 years operating multi-million-dollar service businesses before building a financial practice around the problems he saw firsthand. If your books are behind, your job costing is inconsistent, or you are not sure where your margins are going, sound bookkeeping is the first step toward clarity and growth. Reach out to Truemeasureaccounting to get your financial data working as hard as you do.
FAQ
What is contractor profitability analysis?
Contractor profitability analysis is the process of calculating and tracking true profit margins on construction projects by accounting for all direct costs, burdened labor, subcontractors, equipment, and allocated overhead. It gives contractors a clear picture of which jobs, project types, and clients actually generate profit.
What is a good net profit margin for a contractor?
General contractors typically achieve net profit margins of 3–7%, while specialty trades average 5–9%. Top quartile performers consistently reach 10–15% net margins through overhead discipline and selective bidding.
What is margin fade in construction?
Margin fade is the difference between the profit margin estimated on bid day and the margin a project is actually tracking toward at completion. It is caused by cost overruns, unpriced scope creep, delayed change orders, and poor closeout management.
How do burdened labor rates affect contractor profitability?
Burdened labor rates apply a multiplier of 1.35x–1.65x to base wages to capture payroll taxes, workers’ compensation, benefits, and nonproductive hours. Contractors who estimate using straight wages consistently undercount labor cost and overstate job margins.
How often should contractors review job-level profitability?
Contractors should review projected final margin on every active job at least monthly, and ideally weekly during execution. Real-time cost tracking and cost-to-complete analysis allow project managers to catch and address margin fade before it becomes unrecoverable.