

Budget vs actual reporting (BvA) shows you exactly where your plan and your results diverge — and more importantly, what to do about it. Run a monthly BvA that lists Budget, Actual, Variance, and Variance % for every revenue and expense line, then flag material items for review within 48 hours of close. That single habit replaces guesswork with a documented decision trail.
Here is the column layout you can copy into a spreadsheet or QuickBooks export right now:
Three quick next steps to get started:
- Confirm your baseline. Lock the approved budget in a separate tab or version so it never gets overwritten.
- Compute variance. Subtract Budget from Actual for each line. Divide that result by Budget to get the percentage.
- Apply a materiality filter. Only escalate items that cross both a percentage threshold and an absolute dollar threshold.
Percent-only filters generate noise on small-dollar lines; dollar-only filters miss percentage blowouts on mid-size accounts. Both gates together surface the five to ten lines that actually need your attention, as Basedash recommends.*
Key Takeaways
Effective budget vs actual reporting requires a locked baseline, a two-gate materiality filter, and a documented decision workflow that connects every flagged variance to an owner and an action.
| Point | Details |
|---|---|
| Lock the budget baseline | Store the approved budget as a read-only version before the year starts; never overwrite it with a reforecast. |
| Use the two-gate materiality rule | Flag lines that exceed both a percentage threshold and an absolute dollar threshold to eliminate noise on small-dollar lines. |
| Decompose before you decide | Split variances into price, volume, and efficiency components before assigning a corrective action or reforecasting. |
| Assign owners within 48 hours | Every flagged line needs a written explanation, an owner, and a due date within 48 hours of close to keep BvA a live decision tool. |
| Truemeasureaccounting automates the process | TrueMeasure sets up budget-vs-actual reporting, job-cost templates, and financial-operations follow-up for owner-led service businesses. |
Table of Contents
- What is budget vs actual reporting and when should you run it?
- Why budget vs actual reporting changes the decisions you make
- The formulas and terms you will actually use
- What types of variances exist and what causes them
- How to build a budget vs actual report from your data
- How to present budget vs actual results so leaders act on them
- How to analyze variances and turn findings into decisions
- Worked examples and templates for HVAC, plumbing, and trucking
- Common mistakes that make budget vs actual reports misleading
- Why BvA is really a coaching tool, not just a financial report
- Truemeasureaccounting builds the BvA process so you can focus on running your business
- Sources
What is budget vs actual reporting and when should you run it?
Budget vs actual reporting is the recurring financial report that compares what you planned to spend or earn against what actually happened, across every account, period, and business unit you track. Its job is not to confirm the numbers — your P&L does that. Its job is to surface the gap between plan and reality so you can act on it.
According to ReportingGuru, a well-built BvA report holds managers accountable, supports multiple reporting views across entities and budget versions, and can be automated to deliver consistent outputs on a set schedule. That last point matters for owner-operated firms: you want the report to run itself, not consume a Saturday.
When to run it:
- Monthly at close. Run BvA within three to five business days of month-end, once your books are reconciled.
- After major job milestones. For HVAC installs, construction projects, or trucking contracts, run a job-level BvA when the job closes, not just at month-end.
- After significant external events. A supplier price increase, a large contract win or loss, or a sudden fuel spike all warrant an ad-hoc review.
Key labels you will see in a BvA report:
- Period variance: the gap for the current month only
- YTD variance: cumulative gap from the start of the fiscal year
- Full-year forecast: a revised projection based on current run rate
- Remaining budget: what is left in the approved plan for the rest of the year
The BvA report is not a forecast and it is not your P&L. The P&L tells you what happened. The forecast tells you what will happen. The BvA report tells you how far off the plan you are right now, which is the input both of those documents need to stay useful.
Why budget vs actual reporting changes the decisions you make
Most service business owners look at their P&L and see a number. BvA tells you whether that number is a problem. That distinction drives completely different conversations.
Workday’s guidance on budget variance analysis makes the point clearly: the analytics value is not in the variance itself but in diagnosing whether it is timing-related or structural and what action to take. A $15,000 revenue shortfall in March means something very different if it is a billing timing issue versus a lost recurring contract.
Here is how BvA maps to real operational decisions for service businesses:
- Job-cost overrun on a roofing or HVAC install. Materials came in 18% over budget. That signals a pricing problem, a supplier issue, or scope creep. Without BvA, you finish the job and move on. With it, you adjust your material markup before the next bid.
- Seasonal revenue shortfall for an HVAC company. Revenue is 22% below plan in April. That triggers a reforecast of Q2 cash flow and a decision about whether to run a maintenance promotion or defer a planned equipment purchase.
- Fuel cost spike for a trucking operation. Fuel is 30% over budget per mile. That is an immediate pricing and surcharge conversation, not a wait-and-see situation. Connecting BvA signals to cash flow management keeps a cost spike from becoming a liquidity crisis.
The pattern is consistent: variance signals map to one of four operational responses. Investigate the root cause. Reforecast the remainder of the year. Adjust pricing or job estimates. Or defer discretionary spend until the gap closes. BvA gives you the trigger; the decision is yours.
The formulas and terms you will actually use
Variance analysis uses two core calculations. Everything else is interpretation.
Absolute variance:
Variance = Actual − Budget
Percentage variance:
Variance % = (Actual − Budget) ÷ Budget
The direction of “favorable” or “unfavorable” flips depending on account type, as Investopedia explains. For revenue, actual higher than budget is favorable. For expenses, actual higher than budget is unfavorable. Never apply a single sign convention across the whole report without labeling by account type.
Worked examples for a small service business:
Common variance types you will encounter:
- Price variance. The unit cost or rate changed from what you assumed (e.g., copper pipe costs more than budgeted).
- Volume variance. You did more or fewer units of work than planned (e.g., fewer service calls in a slow month).
- Efficiency variance. Labor or materials consumed more or less than the standard per unit of output (e.g., a job took four hours instead of three).
- Timing variance. Revenue or expense landed in the wrong period due to billing cycles or accrual timing.
- One-time vs. recurring variance. A one-time equipment repair is not a structural problem; a recurring labor overrun is.
IBM’s variance analysis framework recommends separating revenue and expense drivers and using KPIs to interpret results rather than treating every line as equally important. That discipline is what separates a useful BvA review from a number-reading exercise.
What types of variances exist and what causes them
Not every variance deserves the same response. Triage by type first, then by cause.
Variance types by category:
- Price/rate variance: unit cost or billing rate differs from plan
- Volume variance: units sold, jobs completed, or miles driven differ from plan
- Efficiency variance: input consumed per unit of output differs from standard
- Headcount variance: actual FTEs or hours differ from the staffing plan
- Fixed cost variance: overhead came in above or below budget (rent, insurance, equipment leases)
- Variable cost variance: costs that should scale with revenue but did not track as expected
Common operational causes:
- Bad assumptions at budget time. Fuel prices, material costs, or labor rates were estimated without current market data.
- Billing timing. A large invoice was sent in the wrong period, creating a revenue shortfall in one month and a surplus the next.
- Supplier price changes. A mid-year price increase on refrigerant, copper, or diesel that was not reflected in job estimates.
- Scope creep. A job expanded beyond the original estimate without a change order, absorbing labor and materials against the original budget.
- Human error. Miscoded transactions, duplicate entries, or wrong account mapping in QuickBooks.
Triage checklist: what to do with each variance:
- Is the variance above both materiality gates (percentage and dollar)? If not, monitor only.
- Is it a timing issue? If yes, note it and check next month before escalating.
- Is it a one-time event (equipment failure, weather delay)? If yes, document and move on.
- Is it recurring or structural? If yes, reforecast and consider a pricing or operational change.
- Is it caused by a data error? Fix the entry, rerun the report, and document the correction.
Timing variances are the most common source of false alarms. A job billed in April instead of March creates a March shortfall and an April surplus. Treat those as a pair before drawing conclusions. Structural changes, like a lost service contract or a permanent labor rate increase, require a different response entirely.
How to build a budget vs actual report from your data
The report is only as good as the data behind it. Get the data right first, then build the layout.
Step-by-step build process:
- Export your budget. Pull the approved annual budget from your planning tool (QuickBooks budget module, Excel, or a planning platform) at the account and period level. This is your plan table.
- Export your actuals. Pull the general ledger or P&L from your accounting system at the same account and period grain. Accrual-basis actuals give you the cleanest period matching; accrual accounting for service businesses explains why period alignment matters.
- Normalize account mapping. Confirm that account codes in your budget match account codes in your actuals. Mapping drift (a renamed account, a new sub-account) is the most common cause of phantom variances.
- Align period grain. Both tables must be at the same time unit. If your budget is monthly and your actuals export is daily, roll the actuals up to monthly before joining.
- Join the tables. Match on account code and period. Use a full outer join (or VLOOKUP equivalent) so that accounts with a budget but no actuals, and accounts with actuals but no budget, both appear in the output.
- Compute variance and percentage. Variance = Actual − Budget. Variance % = Variance ÷ Budget. Handle zero-budget lines carefully: divide-by-zero errors will break automated reports.
- Apply materiality filters. Flag rows where ABS(Variance %) exceeds your percentage threshold AND ABS(Variance) exceeds your dollar threshold. This is your exceptions feed.
- Version and lock the budget. Once approved, the budget should be read-only. Never overwrite it with a revised forecast. Keep the original budget as “Budget v1” and store reforecasts separately.
Basedash’s implementation guide reinforces the grain-alignment and join logic: building from the data warehouse or connected accounting exports removes manual copy/paste and keeps budget versions immutable for clean comparisons.
Data quality checks to run before publishing:
| Check | What to look for | Fix |
|---|---|---|
| Missing budget lines | Actuals with no matching budget | Add a $0 budget line or flag as unbudgeted |
| Zero-budget handling | Division errors on lines with $0 budget | Replace with “N/A” or suppress percentage |
| Account mapping drift | Budget account codes not matching GL codes | Rebuild mapping table and rerun |
| Duplicate actuals | Same transaction appearing twice | Reconcile GL before exporting |
Pro Tip: Automate the exceptions feed as a separate tab or email alert. Controllers who automate data consolidation and apply materiality thresholds can shift reporting from backward-looking to forward-planning, according to Claryx. The goal is to spend your time on the five to ten flagged lines, not on rebuilding the report from scratch each month.
How to present budget vs actual results so leaders act on them
Layout and cadence matter as much as the math. A report that is hard to read does not get acted on.
Recommended column order:
Start with period columns so readers see the current month first, then YTD for trend context. Adding a “Full-Year Forecast” column to the right gives leadership the forward view without requiring a separate document.
Visualization options by audience:
- Variance waterfall chart. Shows which line items drove the total variance from budget to actual. Best for executive reviews.
- Heat-mapped table. Color-codes cells red/yellow/green by variance magnitude. Best for cost-center managers scanning many lines quickly.
- Trend vs. budget line chart. Plots monthly actuals against the budget line over the year. Best for spotting seasonal patterns and drift.
- Exception list. A filtered table showing only lines above both materiality gates. Best for the 48-hour commentary workflow after close.
For tool selection, ReportingGuru notes that Power BI supports interactive drill-downs and exception lists for managers, while Excel templates remain popular for board packages where a static, printable format is preferred.
Cadence and SLA guidance:
- Monthly close: target BvA delivery within three to five business days of month-end.
- Controller commentary: assign a 48-hour SLA for written explanations on every flagged line. This is the discipline that turns a report into a decision log.
- Board view: summarize to five to eight lines with a narrative. Cost-center leads need the full detail; the board needs the story.
Monthly financials are the foundation. Without a clean monthly close, the BvA report reflects data problems, not business performance.
How to analyze variances and turn findings into decisions
A variance line is a question, not an answer. The analysis workflow converts it into a documented decision.
Investigation template for each flagged line:
- State the variance. “Materials on Job #1047 were $900 unfavorable, 21.4% over budget.”
- Quantify the driver. Was it a price change, a volume change, or an efficiency issue? Break it down.
- Classify it. One-time or recurring? Controllable or uncontrollable?
- Recommend an action. Reforecast, adjust job pricing, correct a data error, or monitor next month.
- Assign an owner and a due date. Variance commentary without an owner is just documentation.
Decomposition techniques:
- Volume vs. price split. If revenue is $2,000 below budget, how much is from fewer units sold versus a lower price per unit? These require different fixes.
- Rate vs. hours split for labor. A labor overrun could be a higher hourly rate (a staffing mix issue) or more hours than estimated (a scheduling or scope issue).
- Direct cost vs. overhead. Separating these prevents a one-time overhead spike from masking a structural direct-cost problem.
IBM’s variance analysis framework recommends keeping revenue and expense decompositions separate, since the drivers and the corrective actions are fundamentally different. Mixing them in a single narrative obscures both.
Decision checklist:
- Reforecast when a variance is recurring and changes the full-year outlook by more than your materiality threshold.
- Adjust job pricing when a cost variance traces back to a systematic underestimate in your bid template.
- Launch a post-mortem when a job closes with a margin below your floor, regardless of whether the variance was flagged mid-job.
- Connect large revenue shortfalls to your cash flow forecast immediately, before the shortfall becomes a liquidity problem.
Pro Tip: Route all variance commentary into a single shared document or project management tool with a comment template: Variance / Driver / Classification / Action / Owner / Due Date. This turns the monthly BvA review into a tracked decision log rather than a conversation that disappears after the meeting. Claryx.ai’s automation guide notes that AI-drafted, human-reviewed commentary shortens the control loop and makes BvA actionable within days of close.
Worked examples and templates for HVAC, plumbing, and trucking
Abstract formulas land differently when you see them applied to a real job.
HVAC residential install: job-cost overrun
Here is what the job-cost BvA looked like at close:
The driver was equipment: a refrigerant unit came in $750 above the estimate because the bid used a prior-quarter price. The fix is a pricing update to the bid template and a supplier conversation. Without the job-cost BvA, this margin erosion would have been invisible until the annual P&L review.
For employee profitability tracking in service businesses, this same framework applies at the technician level: compare budgeted labor hours per job type against actual hours to identify scheduling inefficiencies.
Trucking: fuel variance and per-mile cost decomposition
A trucking operation budgeted $0.42 per mile for fuel on a regional route. Actual fuel cost came in at $0.54 per mile over a 15,000-mile month, producing an unfavorable variance of $1,800.
Decomposition: $0.08 per mile was a diesel price increase (uncontrollable, triggers a fuel surcharge review). $0.04 per mile was idle time and inefficient routing (controllable, triggers a dispatch and driver coaching conversation). Separating those two drivers prevents the wrong fix. A fuel surcharge addresses the price component; route optimization addresses the efficiency component.
Template descriptions:
- P&L-level BvA template: Columns for Account, Period Budget, Period Actual, Period Variance, Period Variance %, YTD Budget, YTD Actual, YTD Variance, Full-Year Forecast, and a Notes field for commentary. Rows organized by P&L section (Revenue, Cost of Goods Sold, Gross Profit, Operating Expenses, Net Income).
- Job-cost BvA template: Columns for Job ID, Cost Category, Budgeted Cost, Actual Cost, Variance, Variance %, and Margin Impact. One row per cost category per job, with a summary row for total job margin.
Common mistakes that make budget vs actual reports misleading
The math is straightforward. The errors are almost always in the setup or the interpretation.
The most common mistakes:
- Mismatched grain. Joining a monthly budget to daily actuals without rolling up the actuals first produces phantom variances that disappear when you fix the aggregation.
- Overwriting the budget. Saving a revised forecast over the original budget destroys your baseline. You can no longer measure plan vs. actual; you are measuring forecast vs. actual, which is a different question.
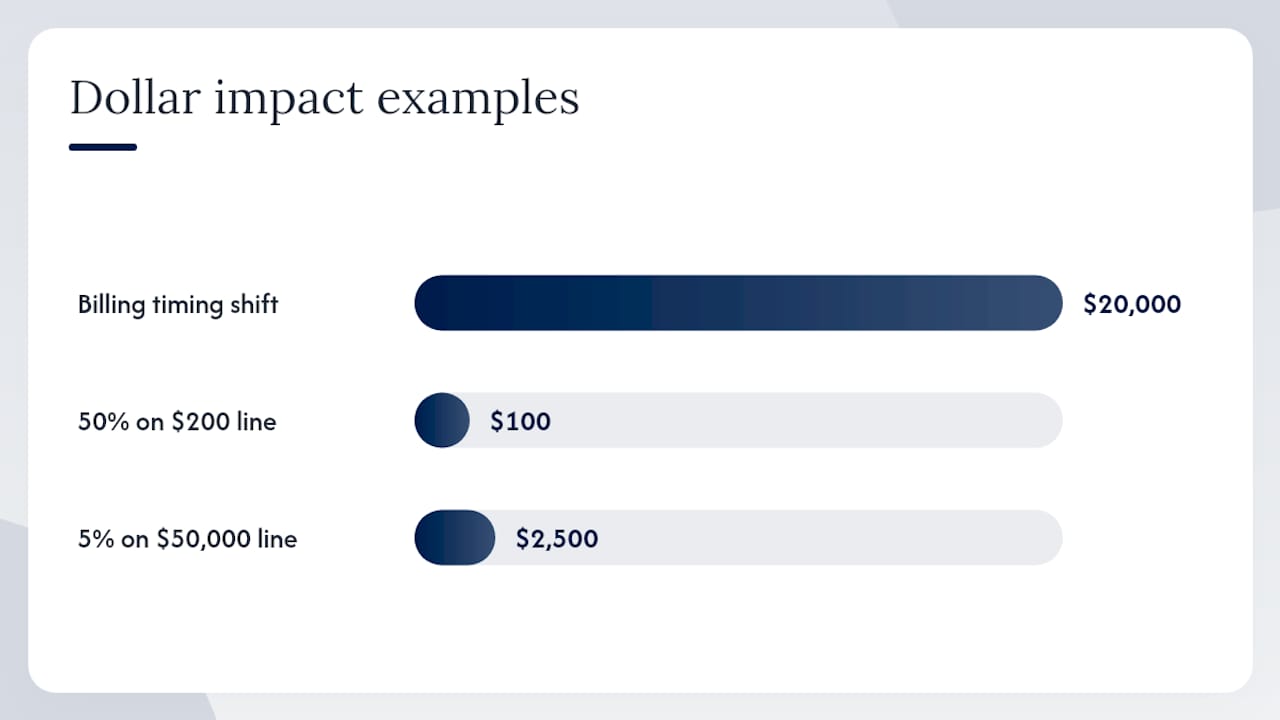
- Treating timing variances as structural. A billing delay that shifts $20,000 of revenue from March to April is not a revenue problem. Escalating it as one wastes investigation time and creates false urgency.
- Using percent-only thresholds. A 50% variance on a $200 line is $100. That is noise. A 5% variance on a $50,000 line is $2,500. That matters. Percent-only filters surface the wrong items.
- Ignoring account mapping drift. When you add a new expense account in QuickBooks mid-year, it may not match any budget line. Actuals pile up in an unmapped account and the variance looks like a data error rather than a real cost.
Quick fixes:
- Lock the approved budget as a read-only version before the fiscal year starts. Store reforecasts in separate columns or tabs.
- Build a mapping table that connects every GL account to a budget line. Review it quarterly.
- Add a “timing flag” column to your exceptions feed. Any variance with a known billing-timing explanation gets flagged and excluded from the structural analysis.
- Apply the two-gate rule (percentage AND dollar) to every threshold decision.
Troubleshooting checklist for unexpected large variances:
- Check the data first: duplicate transactions, missing accruals, wrong period posting.
- Check timing: was revenue or an expense recognized in the wrong month?
- Check account mapping: is the variance in a newly created account with no budget line?
- Check for a legitimate business change: a new contract, a lost customer, a price increase.
- Check for human error: a transposition, a wrong vendor code, a miscategorized expense.
Work through that list in order before escalating. Most large unexpected variances resolve at step one or two.
Why BvA is really a coaching tool, not just a financial report
Most finance teams treat budget vs actual reporting as a compliance exercise. Run the report, file it, move on. That framing misses the real value.
The most useful thing a BvA report does is create a structured conversation between finance and operations. It is a pricing problem, a supplier problem, or an estimating problem. The BvA report surfaces it; the operations conversation fixes it.
For small service businesses, the constraint is usually not data. It is attention. Owners are running jobs, managing crews, and handling customers. A report that dumps 80 variance lines on a desk every month does not get read. A report that surfaces five flagged lines with a one-sentence explanation for each one gets acted on. That is the difference between a materiality-filtered BvA and a raw export.
The other underappreciated point: BvA is most valuable when it is connected to predictive financial forecasting. A variance that changes your full-year outlook should immediately trigger a reforecast, not wait for the annual budget cycle. Firms that treat BvA as a trigger for forecast updates make better decisions than firms that treat it as a historical record.
The practical priority for small firms: automate the data pull and the exception filter first. That alone cuts the monthly reporting effort significantly and shifts the conversation from “did we run the report?” to “what do we do about line seven?”
Truemeasureaccounting builds the BvA process so you can focus on running your business
Owner-operated service businesses between $250,000 and $5 million in revenue often have the data to run solid budget vs actual reporting. What they lack is the setup: a clean chart of accounts, a locked budget baseline, a materiality-filtered exception feed, and someone to write the commentary and connect the findings to operational decisions.
Truemeasureaccounting builds exactly that. The financial reporting services include automated BvA dashboards connected to your QuickBooks data, a variance commentary workflow with assigned owners and due dates, job-cost BvA templates for HVAC, plumbing, construction, and trucking firms, and fractional CFO follow-up to turn variance findings into pricing, hiring, and cash flow decisions. The bookkeeping services foundation ensures your actuals are clean before the report runs. Implementation timing depends on the quality of the underlying books and systems; the goal is to move from manual spreadsheet exports to a repeatable, materiality-filtered BvA process. Schedule a free assessment at Truemeasureaccounting to see what your numbers are actually telling you.
Sources
These sources cover different aspects of budget vs actual reporting. Match your reading need to the right resource:
- How to Calculate a Budget Variance Analysis (With Formulas) | Workday US
- How to build a budget vs actual report | Basedash
- Budget vs Actual Reporting (SSRS, Power BI, Excel) | ReportingGuru
- Budget variance definition and explanation | Investopedia
- Variance analysis overview | IBM
- Budget vs Actual Analysis: Complete Guide for Finance Controllers – Planir
This article is general information, not a substitute for advice from a qualified financial advisor. Consult a qualified financial professional about your own circumstances before acting on anything here.